
Figures & data
Figure 1. (a) Schematic of ECM (without cell) used to fit impedance spectrum with no cell passing (Zsolution), aiming to calculate the values of the medium capacitor () and medium resistor (
). (b) Schematic of ECM (with cell) to estimate the value of membrane capacitance (
) and cytoplasm resistance (
) (‘green’ and ‘red’ represent membrane and cytoplasm, respectively) by fitting with Zmix measurement data. (c) The schematic of electric field penetration in cells with varying viability stages at low and high frequencies. In low frequency, the cell membrane acts as a substantial impediment to current penetration, allowing for the measuring of cell size. While in high frequency, the membrane polarization decreases and current may penetrate the cell membrane giving information about the membrane properties.
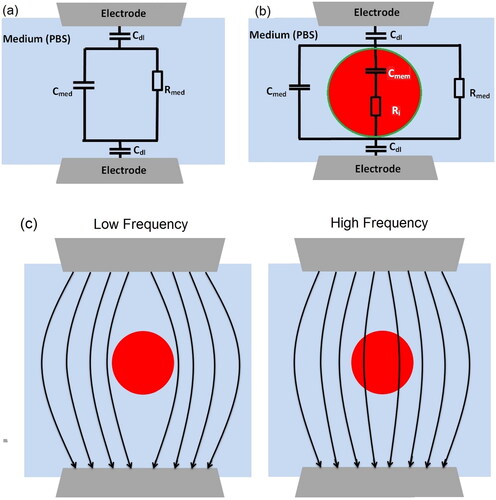
Figure 2. The schematic diagram for the experiment. The micromanipulator was used to hold and drive the tungsten needles inside the microfluidic channel and the alignment of the needle gap was obtained using imaging software.
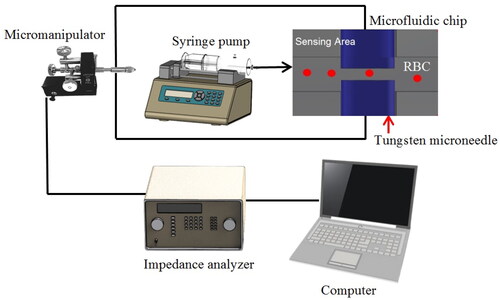
Figure 3. The detection of microbeads of 7 µm size at the detection area based on impedance change of the medium. The red dash line is set as the impedance magnitude threshold of 7 µm diameter microbeads and frequency measurement at 500 kHz.
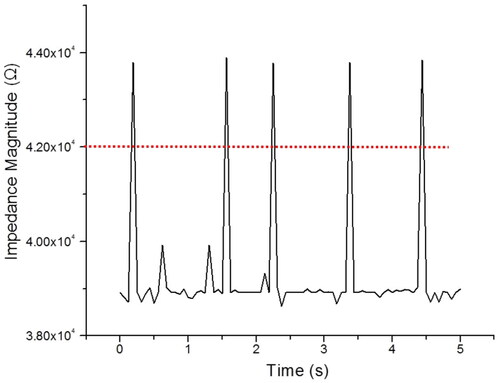
Figure 4. The mixed PS beads and RBCs suspending inside the microchannel of the IFC device. ‘Green’, ‘black’, ‘blue’ and ‘red’ box represent RBCs, 5 µm microbead, 7 µm microbead and 10 µm microbead, respectively.
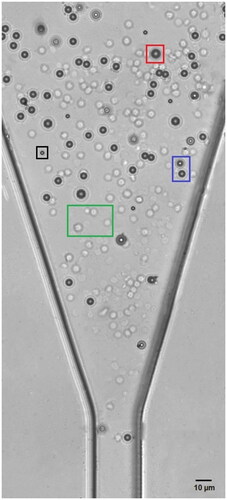
Figure 5. Calibration data for the device at low-frequency measurement (100 kHz). Three different sizes of PS beads and RBCs were flowed inside the microchannel to measure the magnitude of the impedance and obtain the calibration curve. The calibration curve was utilized to determine the magnitude of impedance RBC.
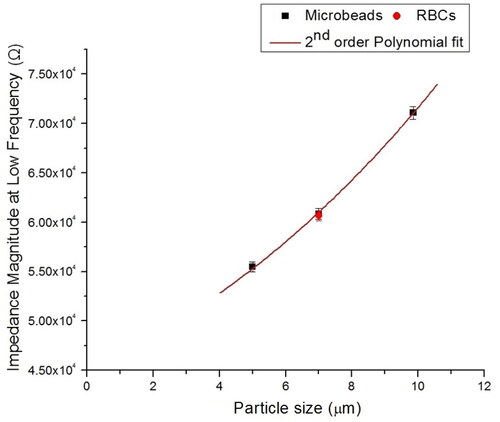
Figure 6. Impedance spectrum of three different sizes of microbeads (5, 7 and 10 µm).
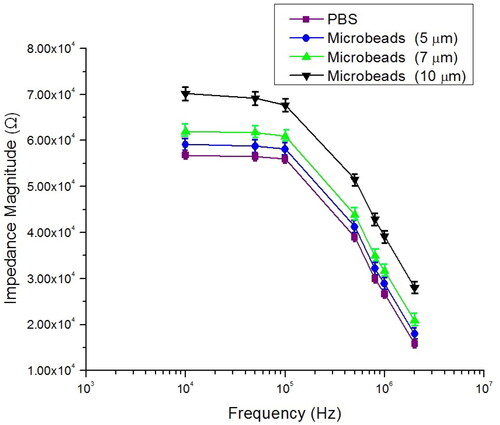
Figure 7. Impedance magnitude profiles (at five frequencies) measured within 5 s with 4–5 cells passing through the detection area. Impedance profiles of different frequencies are plotted in different colours.
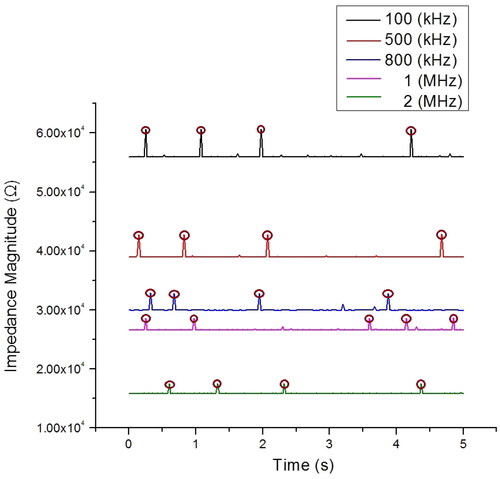
Figure 8. (a) Total impedance spectrum of RBC at seven frequencies measurement. With an increase in frequency, the measurable change in impedance decreases. (b) Threshold for single-cell RBC based on impedance change (ΔZ) set in the range 3850–3940 Ω based on data collected at 500 kHz.
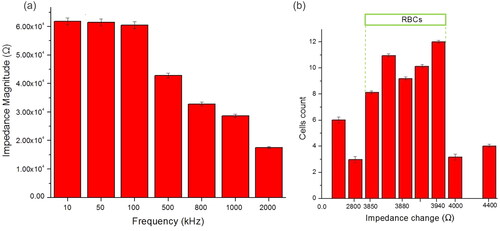
Figure 9. Scatter plot of opacity against impedance magnitude at low frequency (100 kHz) for a mixture of RBCs and 7 µm diameter microbeads. Opacity is defined as the ratio of the high-frequency to the low-frequency impedance, which indicates changes in the cell membrane and the independency of cell size.
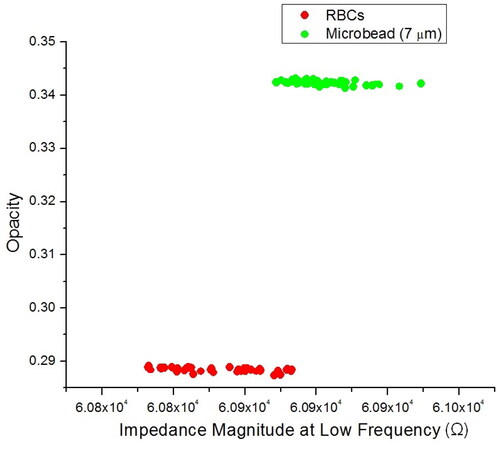
Figure 10. Measurement impedance magnitude of PBS and RBCs at selected frequency point between 100 kHz and 2 MHz.
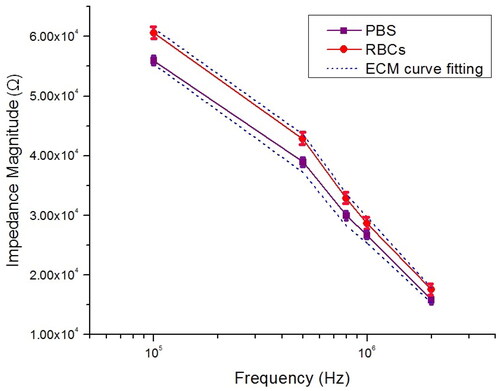
Table 1. The simulated value of the electrical element in the ECM with and without RBC.
Supplemental Material
Download MS Word (1.1 MB)Data availability statement
The pre-print version of the manuscript is available at Research Square: https://assets.researchsquare.com/files/rs-1660328/v1_covered.pdf?c=1653060126. Data available on request from the authors.