
Figures & data
Figure 1. Image of BE-transflow microdevice. Created by BEOnChip.
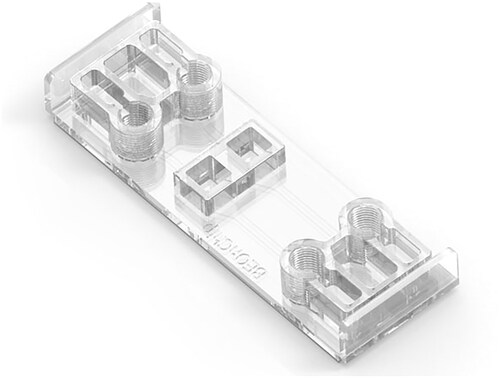
Figure 2. Biological evaluation of BE-transflow microdevices according to ISO 10993-5 standards. (a) Direct contact assay. (b) Indirect contact assay. (c) Adhesion assay. **p < 0.005 ***p < 0.001 compared with control.
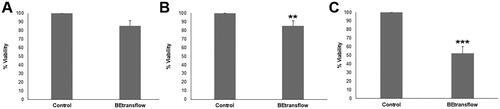
Figure 3. (A) Calcein/propidium Iodide microscopy images at 14 days after HaCaT cells seeding, green and red fluorescence denote live and dead cells, respectively. (B) Haematoxylin-eosin staining of stratified epithelia cross section after 14 days. (C) Cytokeratin 14, (D) Cytokeratin 10 and (E) Cytokeratin 2 staining of stratified epithelia cross section after 14 days in green. Cell nuclei were counterstained with DAPI (blue).
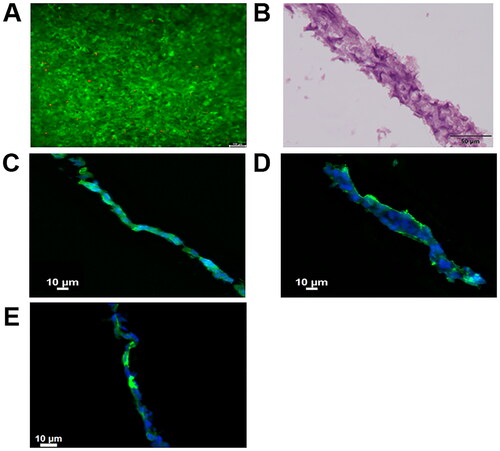
Figure 4. (A) Permeability of fluorescein (mol/m−3x103) quantified overtime every 30 min up to 8 h (B) Permeability of fluorescein (mol/m−3x103) quantified overtime every 10 min up to 4 h (C) Permeability of fluorescein isothiocyanate-dextrans (dextran) of 4000, 10,000, 20,000, and 40,000 g/mol molecular weight (mol/m−3x103) quantified overtime every 30 min up to 8 h (D) Weighted least‐Squares fitting between calculated permeability coefficient (m/sec)x10−8 from quantified permeability and the inverse of the described Stokes radius ((m−1)x109)) from the studied fluorescein isothiocyanate-dextrans represented.
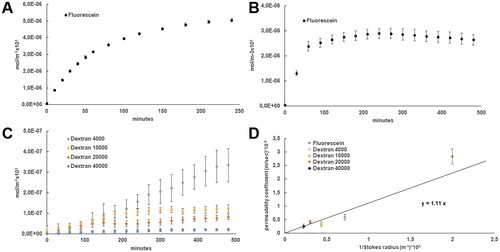
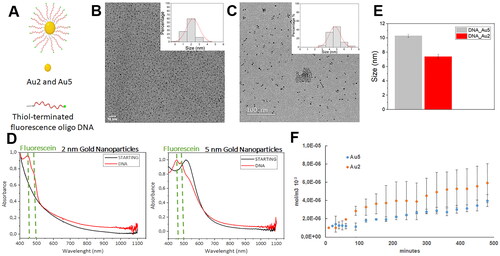
Figure 5. (A) Schematic representation of FAM-labelled oligonucleotide nanocarriers. Transmission electron microscopy representative micrographs. and diameter determination after acquired image analysis of Au2 (B) and Au5 (C) DNA conjugated-nanoparticles suspensions. (D) UV-vis spectra of unlabelled (STARTING Au2 and Au 5 NPs black curves) and labelled ssDNA functionalised Au2 and Au NPs (DNA, red curves) (E) Hydrodynamic diameter of Au2 and Au5 by dynamic light scattering (DLS) (F) Permeability of functionalised Au2 and Au5 nanoparticles (mol/m−3x103) quantified overtime every 10 min from the first hours and every 30 min for 8 h.
Supplemental Material
Download TIFF Image (1.9 MB)Supplemental Material
Download TIFF Image (2.2 MB)Data availability statement
Data is available on request from the authors. The data that support the findings of this study are available from the corresponding author, [JC], upon reasonable request.