
Figures & data
Table 1. Flour attribute, manufacturing control, and quality summaries
Table 2. Flour quality descriptive statistics by supplier
Figure 1. Data-driven process optimization framework.
Figure 2. Diagram of the manufacturing process.
Table 3. Descriptive statistics of manufacturing controls
Table 4. Estimated regression coefficients
Table 5. Estimated regression distribution tests
Table 6. Observed vs. optimized results
Table 7. Supplier results
Table A1. Estimated regression coefficients of Model B
Table A2. Estimated regression coefficients of Model C
Table A3. Comparison between the three candidate models
Figure A1. Observed flour protein monthly mean and variance by supplier.
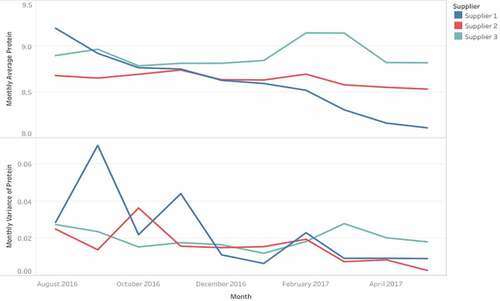
Figure A2. Observed flour moisture monthly mean and variance by supplier.
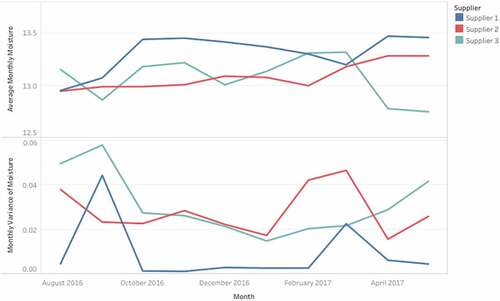
Figure A3. Observed flour mixing tolerance index monthly mean and variance by supplier.
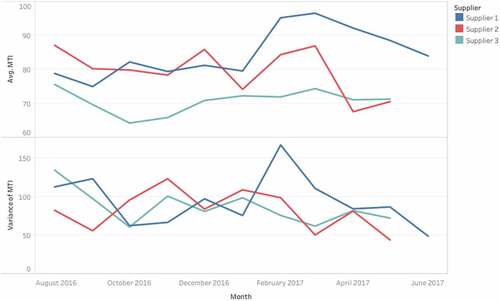
Figure A4. Observed flour ash monthly mean and variance by supplier.
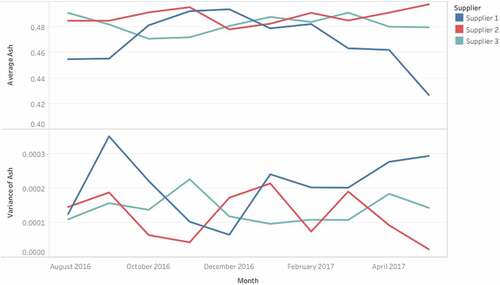
Table A4. Correlation matrix Supplier 1 Added water and Flour batch attributes
Table A5. Correlation matrix Supplier 2 Added water and Flour batch attributes
Table A6. Correlation matrix Supplier 3 Added water and Flour batch attributes