Figures & data
Table 1. Comparison of relevant design approaches and respective steps.
Figure 1. Developed process for the extension of learning factories regarding new topics.
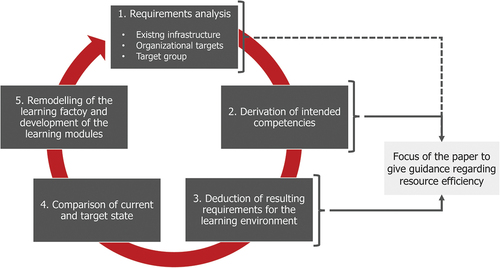
Figure 2. The considered methods in the framework for increasing resource efficiency by Weyand, Rommel, et al. (Citation2021).
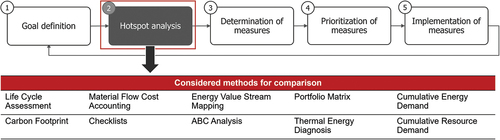
Table 2. Description of the considered methods.
Figure 3. Approach for rating the hotspot analysis methods.
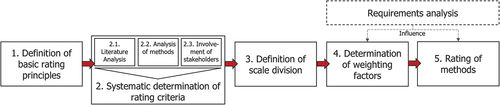
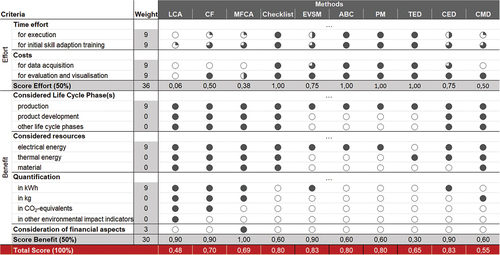
Table 3. Matrix of efforts and benefits for each method, applied to the ETA Learning Factory at TU Darmstadt (in case of alternatives, default scenario is marked bold).
Table 4. Resulting scale division for each rating criterion.
Figure 4. Examples of different options to get the weighting scale: paired comparison (A) and direct numbers (B).
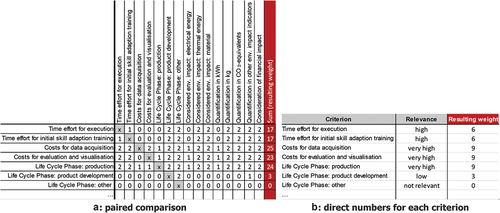
Table 5. Extract of the competency matrices including respective requirements, developed for each hotspot analysis method.
Figure 5. Approach for learning factory operators to address resource efficiency methods.
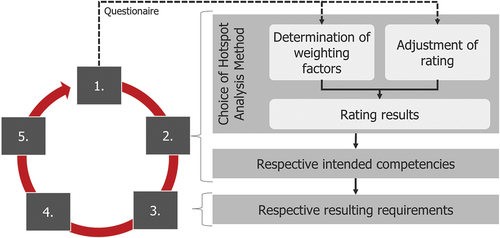
Figure 6. Rating of the methods with adjusted weighting according to the identified requirements and prerequisites in the CiP Learning Factory.