
Figures & data
Table 1. Summary of X-ray diffraction analysis and mechanical properties of TTZ ceramics
Figure 1. X-ray diffraction of the TTZ ceramic after SPS consolidation at 1973°C and following the flexural strength test at 1800°C. The inset shows refinement details for deformed specimen at 1800°C for high-angle peaks. The bars indicate the allowed Bragg reflections for the Fm-3 m structure. Observed lattice parameter as SPSed specimen a= 4.458 Å, deformed at 1800°C: a = 4.4583(6) Å, a = 4.4369(2) Å, and a = 4.4937(3) Å (see )
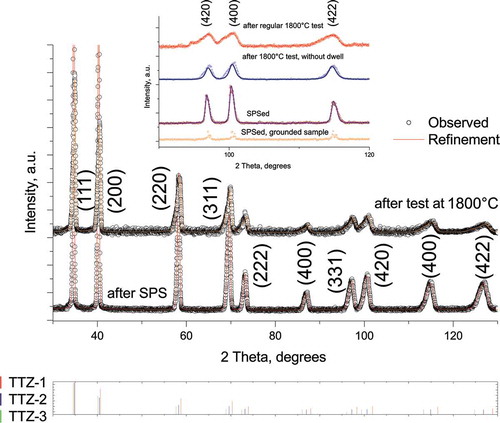
Figure 2. Fracture of the TTZ ceramic after flexural strength tests at (a,b) room temperature, (c,d) at 1000°C, and (e,f) at 1600°C. (a,c,e) images acquired using the SE mode, while (b,d,f) used the BSE mode
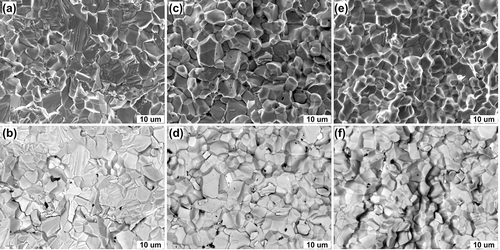
Figure 3. Fracture of the TTZ ceramic after fracture toughness test at 1800°C using two different magnifications (×500, and ×2000). Areas of local carbide decomposition are marked with red (Ti) and green colors (Ta), equimolar TTZ carbide is colored with blue. Uncolored areas are due to EDX’s depth limitation
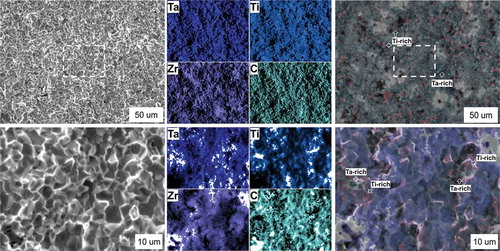
Table 2. Hardness data on monolithic UHTC carbides and high-entropy carbides
Figure 4. Effect of temperature on the flexural strength of (Ta1/3Ti1/3Zr1/3)C prepared in this study. (a) provides variation in strength for TTZ ceramic and for selected monolithic carbides [Citation31–37]. The closed symbols indicate that the strength was measured using a four-point setup and the open symbols show the results of the three-point flexural strength tests. (b) shows typical loading curves for TTZ ceramics at 25°C, 1000°C and 1800°C. Dashed lines in (b) visually show the Young’s modulus evolution during the flexural tests at different temperatures. Data for 1600°C are not shown for clarity as they overlap with the data for 1000°C
![Figure 4. Effect of temperature on the flexural strength of (Ta1/3Ti1/3Zr1/3)C prepared in this study. (a) provides variation in strength for TTZ ceramic and for selected monolithic carbides [Citation31–37]. The closed symbols indicate that the strength was measured using a four-point setup and the open symbols show the results of the three-point flexural strength tests. (b) shows typical loading curves for TTZ ceramics at 25°C, 1000°C and 1800°C. Dashed lines in (b) visually show the Young’s modulus evolution during the flexural tests at different temperatures. Data for 1600°C are not shown for clarity as they overlap with the data for 1000°C](/cms/asset/b6abda6f-0a30-47c9-a35c-5c61b650ee8b/tace_a_1840703_f0004_oc.jpg)
Figure 5. Fracture of the TTZ ceramic after flexural strength tests at 1800°C using an immediate loading procedure. Insets show a linear mapping for Ta, Ti and Zr performed on the flat neighboring grains. Dotted lines show a tolerance limit for equimolar composition 16.6 at.% (assuming that C occupies 50 at.%)
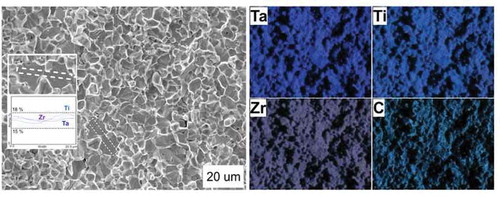
Figure 6. Possible toughening mechanism due to local chemical gradient at ambient temperature and at 1800°C. Microcracks and related force fields are being generated as a result of the local carbide decomposition into several phases, initial medium-entropy or high-entropy carbide acts as a matrix under residual compressive stresses. These microcracks may shield crack tip during fracture, or directly pin the crack. Note, that microcracks after the flexural strength tests at 2000°C were observed in ref [Citation8], Scr Mat. Right image shows crack propagation behavior at the lateral surface of the test bar after fracture toughness test following three-point flexure at 1800°C (SE mode)
![Figure 6. Possible toughening mechanism due to local chemical gradient at ambient temperature and at 1800°C. Microcracks and related force fields are being generated as a result of the local carbide decomposition into several phases, initial medium-entropy or high-entropy carbide acts as a matrix under residual compressive stresses. These microcracks may shield crack tip during fracture, or directly pin the crack. Note, that microcracks after the flexural strength tests at 2000°C were observed in ref [Citation8], Scr Mat. Right image shows crack propagation behavior at the lateral surface of the test bar after fracture toughness test following three-point flexure at 1800°C (SE mode)](/cms/asset/e319b015-fe1f-4d24-a9e8-fa84151884ff/tace_a_1840703_f0006_oc.jpg)
Figure 7. Change in fracture toughness during cooling (a,b) and (d,c) reheating using different relation in CTE between matrix and inclusion
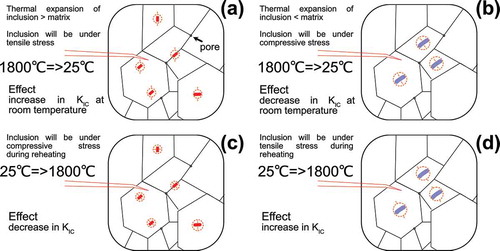
Table 3. Data on thermal expansion and Young moduli for TaC – HfC ceramic based on ref [Citation25]
Table 4. Evaluation of the thermal stresses and change in toughness for different matrix – inclusion configurations based on data of ref [Citation25]