Figures & data
Figure 1. Fracture surface morphologies and pore size distributions for various TiB2-SiC preforms with TiB2 content of: (a)(b)(c) 15 vol%, (d)(e)(f) 20 vol%, (g)(h)(i) 25 vol%, and (j)(k)(l) 30 vol%, respectively.
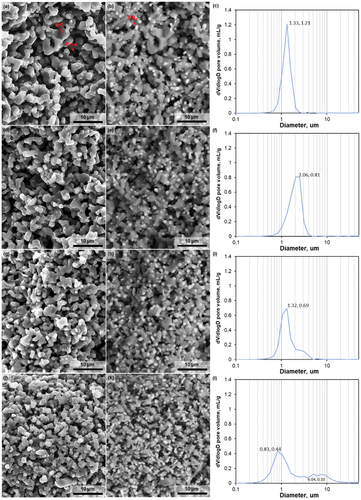
Figure 2. Porosity and flexural strength of TiB2-SiC preforms as a function of TiB2 content.
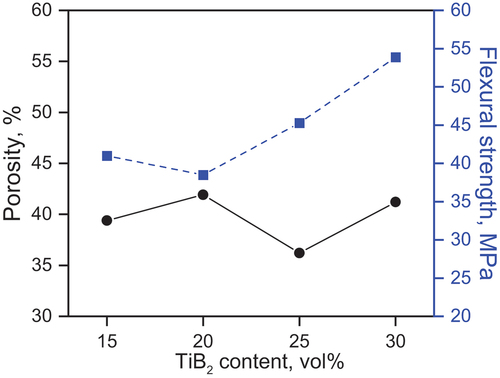
Figure 3. Schematic illustration of TiB2-SiC porous preform formation.
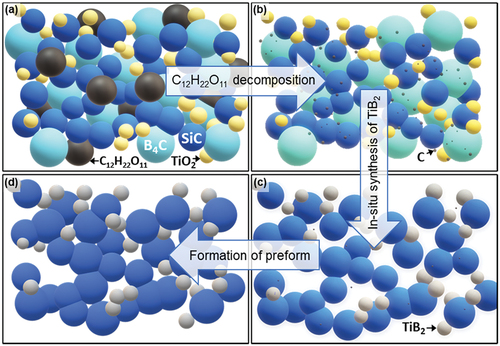
Figure 4. XRD patterns of (a) starting powders, (b) 20 vol% TiB2-SiC preform and (c) 20 vol% Al/TiB2-SiC composite.
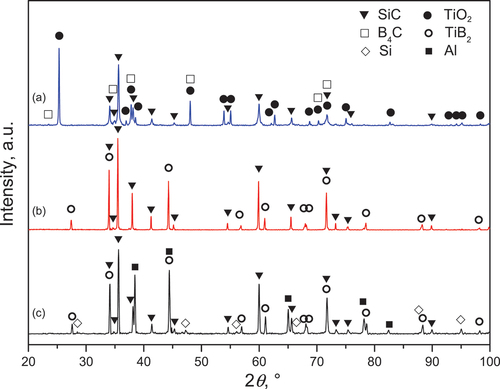
Figure 5. Porosity and density of Al/TiB2-SiC composites as a function of TiB2 content.
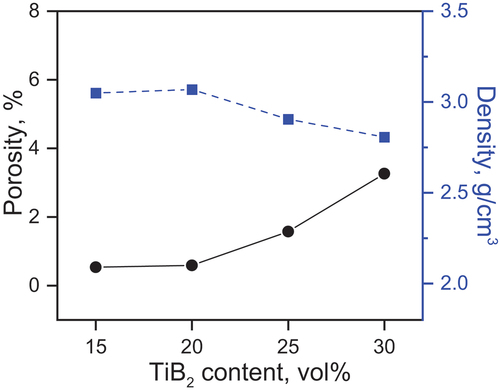
Figure 6. (a) SEM micrographs of 25 vol% Al/TiB2-SiC composite, (b) EDS elemental composition and (c) normalized Al, SiC, TiB2 phase content as a function of TiB2 content.
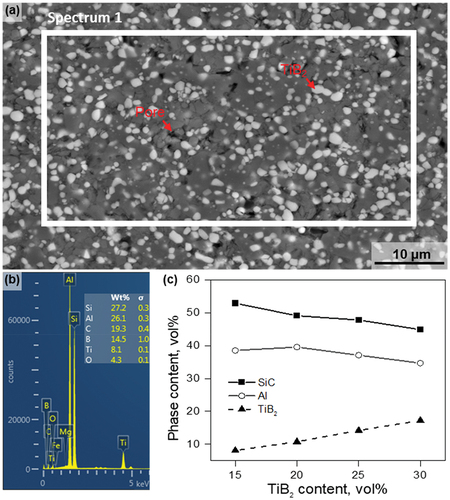
Figure 7. (a) SEM micrographs of 25 vol% Al/TiB2-SiC composite with EDS line scanning analyses and (b) corresponding EDS line profiles of Al, Si, and Ti elements.
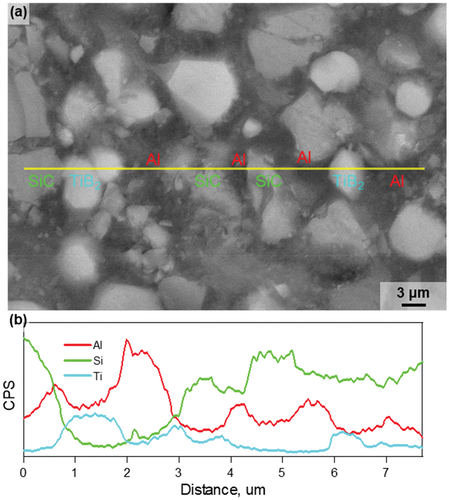
Figure 8. (a) Hardness of Al/TiB2-SiC composites as a function of TiB2 content and (b) SEM image of hardness indentation morphology of 25 vol% Al/TiB2-SiC composite.
Figure 9. Flexural strength and fracture toughness of Al/TiB2-SiC composites as a function of TiB2 content.
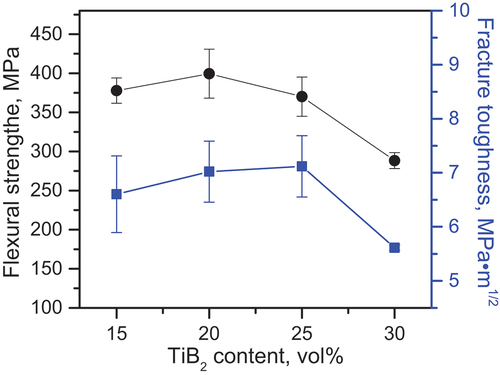
Figure 10. EDS element distributions maps of 20 vol% Al/TiB2-SiC composite for (a) SEM fractography, (b) Ti, (c) Al, and (d) Si.
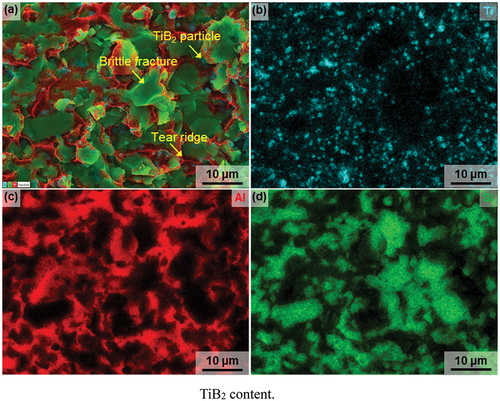
Figure 11. SEM micrographs of the fracture surfaces for Al/TiB2-SiC composites with different TiB2 contents: (a)(b) 15 vol%, (c)(d) 20 vol%, (e)(f) 25 vol%, and (g)(h) 30 vol%, respectively.
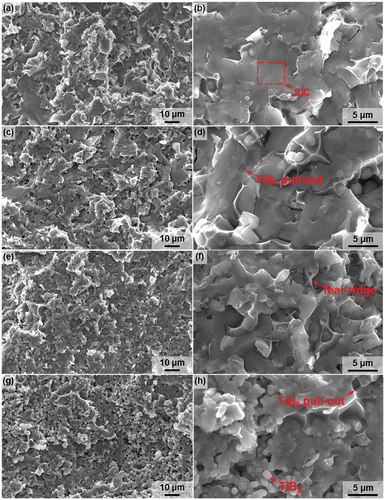
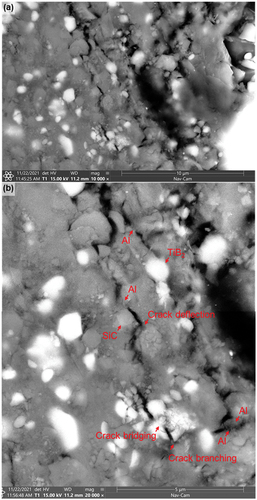
Figure 12. Crack propagation path of 20 vol% Al/TiB2-SiC composite in (a) low-magnification and (b) high-magnification.