
Figures & data
Figure 1. Schematic image of an AD system.
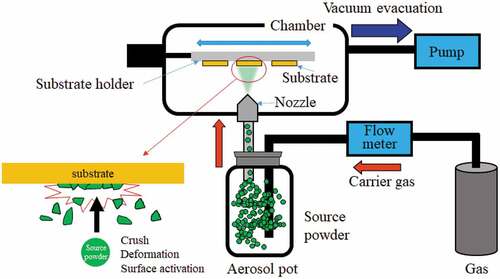
Figure 2. Schematic of three types of Ox-SSBs (a) bulk-type, (b) thin-film-type, and (c) multilayered-type.
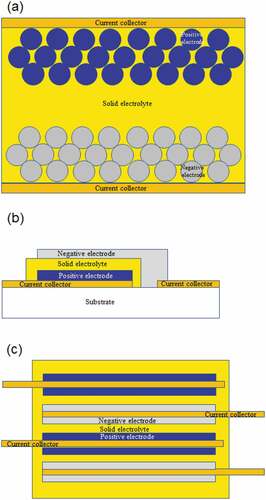
Figure 3. (a) SEM images of LATP-dispersed NMC particles, where LTP-x (x = 0, 2, 5, 10, and 20) denotes the powders prepared by NMC:LATP = 100:x (w/w). (b) Surface coverage ratios of LATP in LTP-x powders. (c) Cross-sectional SEM images of NMC–LATP composite films prepared using LTP-x on Si substrates. (d) Relationship between film thickness and NMC amount in the film against x in LTP-x as the source powders. (e) (Top) cross-sectional SEM image of NMC–LATP composite film prepared using LTP-5 on LLZ substrate. (Middle) charge–discharge curves of Li/LLZ/NMC–LATP battery at 100°C. (Bottom) variation of discharge capacities with cycles at different current densities of 50–1000 μA cm−2 (Reprinted from [29] with permission from Elsevier).
![Figure 3. (a) SEM images of LATP-dispersed NMC particles, where LTP-x (x = 0, 2, 5, 10, and 20) denotes the powders prepared by NMC:LATP = 100:x (w/w). (b) Surface coverage ratios of LATP in LTP-x powders. (c) Cross-sectional SEM images of NMC–LATP composite films prepared using LTP-x on Si substrates. (d) Relationship between film thickness and NMC amount in the film against x in LTP-x as the source powders. (e) (Top) cross-sectional SEM image of NMC–LATP composite film prepared using LTP-5 on LLZ substrate. (Middle) charge–discharge curves of Li/LLZ/NMC–LATP battery at 100°C. (Bottom) variation of discharge capacities with cycles at different current densities of 50–1000 μA cm−2 (Reprinted from [29] with permission from Elsevier).](/cms/asset/2a53c6d0-62e6-433f-aceb-dd0daf7c1f39/tace_a_2163080_f0003_oc.jpg)
Figure 4. (a) SEM image of LNM source powder. (b) Cross-sectional SEM image of an LNM–LATP composite electrode formed on Pt substrate. (c) Cross-sectional SEM image of LNM–LATP composite electrode. (d) Discharge curves of Li/LiPON/LNM–LATP composite electrodes at 100°C. Charging current density was fixed at 10 μA cm−2 while the discharge current densities were varied from 10 to 200 μA cm−2. (e) Variation of discharge capacity of Li/LiPON/LNM–LATP (composite electrode) with cycles at 25°C–100°C at 10 μA cm−2. The discharge capacity variations of a thin-film-type Ox-SSB of Li/LiPON/LNM (thin-film, 30 nm in thickness) are also shown as the reference (Reprinted from [30] with permission from Elsevier).
![Figure 4. (a) SEM image of LNM source powder. (b) Cross-sectional SEM image of an LNM–LATP composite electrode formed on Pt substrate. (c) Cross-sectional SEM image of LNM–LATP composite electrode. (d) Discharge curves of Li/LiPON/LNM–LATP composite electrodes at 100°C. Charging current density was fixed at 10 μA cm−2 while the discharge current densities were varied from 10 to 200 μA cm−2. (e) Variation of discharge capacity of Li/LiPON/LNM–LATP (composite electrode) with cycles at 25°C–100°C at 10 μA cm−2. The discharge capacity variations of a thin-film-type Ox-SSB of Li/LiPON/LNM (thin-film, 30 nm in thickness) are also shown as the reference (Reprinted from [30] with permission from Elsevier).](/cms/asset/b88f5e98-01a2-498e-b796-c06da4fcd02a/tace_a_2163080_f0004_oc.jpg)
Figure 5. (a) SEM image of LCO particles used to prepare LCO–LATP single stack. (b) Cross-sectional SEM image of LCO–LATP stack. (c) Raman spectra of LCO–LATP stacked without (RT) and with annealing at 300°C, 400°C, 500°C, and 600°C. (d) Variation of interfacial resistance at LCO/LATP at 4.0 V (vs. Li/Li+) without and with annealing. (e) Charge–discharge curves of Li/LLZ/LCO–LATP (composite electrode) at 100°C after annealing at 400°C. The charging current density was fixed at 0.05 mA cm−2 while the discharge current density was varied at 0.05–100 mA cm−2 (Reprinted from [34] with permission from John Wiley and Sons).
![Figure 5. (a) SEM image of LCO particles used to prepare LCO–LATP single stack. (b) Cross-sectional SEM image of LCO–LATP stack. (c) Raman spectra of LCO–LATP stacked without (RT) and with annealing at 300°C, 400°C, 500°C, and 600°C. (d) Variation of interfacial resistance at LCO/LATP at 4.0 V (vs. Li/Li+) without and with annealing. (e) Charge–discharge curves of Li/LLZ/LCO–LATP (composite electrode) at 100°C after annealing at 400°C. The charging current density was fixed at 0.05 mA cm−2 while the discharge current density was varied at 0.05–100 mA cm−2 (Reprinted from [34] with permission from John Wiley and Sons).](/cms/asset/3fc6f172-0c45-4efd-8e67-1fd2612cef82/tace_a_2163080_f0005_oc.jpg)
Figure 6. (a) (Left) Surface and (right) cross-sectional SEM images of LGVO-coated LLZ substrates. (b) (Left) charge–discharge curves of Li/LLZ/LCO at 25°C (LLZ/LCO was annealed at 700°C). (Right) Nyquist plots of Li/LLZ/LCO at 25°C measured at 3.0 V (blue) and 4.0 V (red). (c) (Left) charge–discharge curves of Li/LLZ/LGVO/LCO at 25°C (LLZ/LGVO/LCO stack was annealed at 700°C). (Right) Nyquist plots of Li/LLZ/LGVO/LCO at 25°C measured at 3.0 V (blue) and 4.0 V (red) (Reprinted from[42] with Copyright 2022 American Chemical Society).
![Figure 6. (a) (Left) Surface and (right) cross-sectional SEM images of LGVO-coated LLZ substrates. (b) (Left) charge–discharge curves of Li/LLZ/LCO at 25°C (LLZ/LCO was annealed at 700°C). (Right) Nyquist plots of Li/LLZ/LCO at 25°C measured at 3.0 V (blue) and 4.0 V (red). (c) (Left) charge–discharge curves of Li/LLZ/LGVO/LCO at 25°C (LLZ/LGVO/LCO stack was annealed at 700°C). (Right) Nyquist plots of Li/LLZ/LGVO/LCO at 25°C measured at 3.0 V (blue) and 4.0 V (red) (Reprinted from[42] with Copyright 2022 American Chemical Society).](/cms/asset/e0a346e9-a6a6-4f58-9597-8df9c2fda3a5/tace_a_2163080_f0006_oc.jpg)
Figure 7. (a) Cross-sectional SEM image of CC/LiPON/LCO stack and (b) Optical image of flexible thin-film-type Ox-SSBs. (Reprinted from [49] with permission from Elsevier) (c) Optical image of electrode–solid electrolyte single stack with wide-area electrode coatings. The substrates are (left) LLZ and (right) LATP (Reprinted from [34] with permission from Elsevier).
![Figure 7. (a) Cross-sectional SEM image of CC/LiPON/LCO stack and (b) Optical image of flexible thin-film-type Ox-SSBs. (Reprinted from [49] with permission from Elsevier) (c) Optical image of electrode–solid electrolyte single stack with wide-area electrode coatings. The substrates are (left) LLZ and (right) LATP (Reprinted from [34] with permission from Elsevier).](/cms/asset/c5ccbece-9a13-4b76-a51b-adff6e4f5406/tace_a_2163080_f0007_oc.jpg)