
Figures & data
Figure 1. XRD patterns of 20–80 ° and 42–46 ° for (a1)(a2) BT raw sample and BCT raw sample and (b1)(b2) BT-based sample and BCT-based sample.
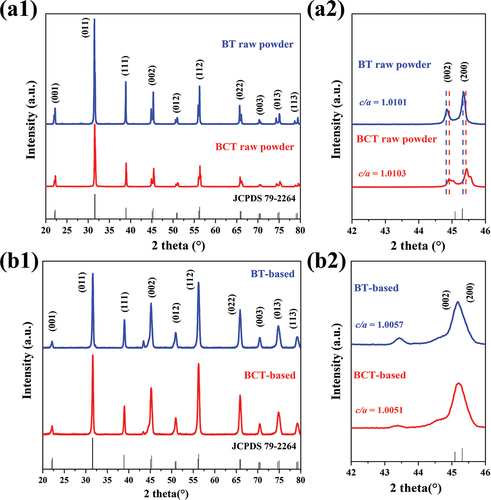
Figure 2. Raman Spectrum of (a) BT-based sample and (b) BCT-based sample from −55 ℃ to 150 ℃. Raman Spectrum Zoom of BT-based sample and BCT-based sample (c) at the temperature of −55 ℃, 0 ℃, 25 ℃ and 125 ℃, respectively.
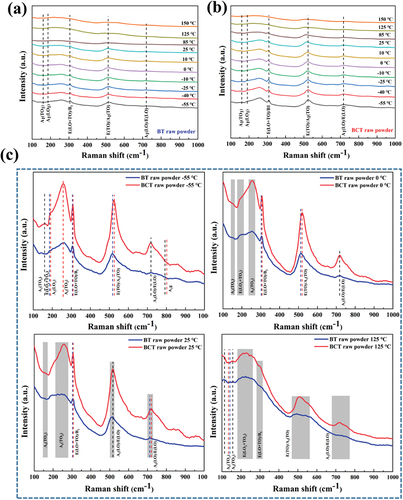
Figure 3. (a)(b) FESEM micrograph of BT-based dielectric layer and TEM micrograph, EDS mapping of core-shell structure and map scanning of the Dy distribution for (a) BT-based sample and (b) BCT-based sample, respectively.
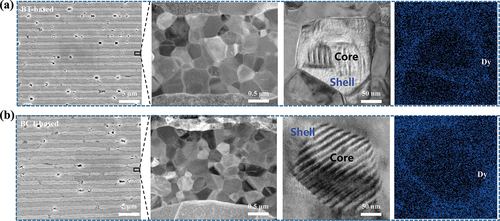
Figure 4. Temperature dependence of (a) the dielectric constant and dissipation factor and (b) TCC curves of BT-based sample and BCT-based sample from −75 ℃ to 200 ℃. Grain size distributions for (c) BT-based sample and (d) BCT-based sample.
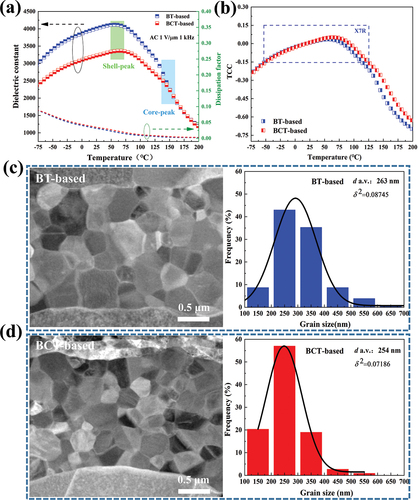
Figure 5. (a) Dielectric constant dependence of AC-electric field and schematic sketches of domain configuration for BT-based sample and BCT-based sample at −55 ℃, 25 ℃, 85 ℃ and 125 ℃, respectively. (b) Evolution of reversible FORC distributions for BT-based sample and BCT-based sample at −55 ℃, 25 ℃, 85 ℃ and 125 ℃, respectively.
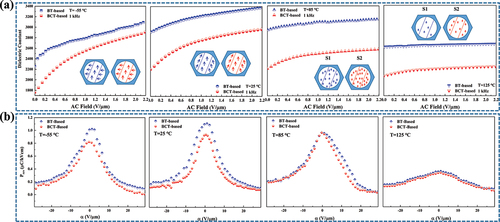
Figure 6. (a)(b) Evolution of irreversible FORC distributions for BT-based sample and BCT-based sample at −55 ℃, 25 ℃, 85 ℃ and 125 ℃, respectively.
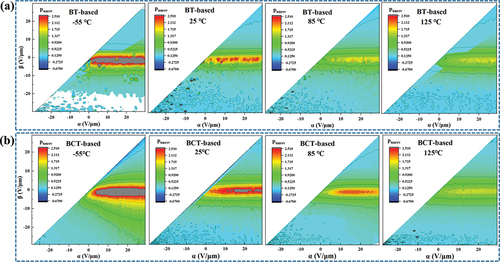
Figure 7. (a) Photograph of BT-based sample and BCT-based sample. (b) Breakdown field and Weibull distributions of BT-based sample and BCT-based sample, respectively. (c) The high-temperature IR degradation curves of BT-based sample and BCT-based sample, respectively.
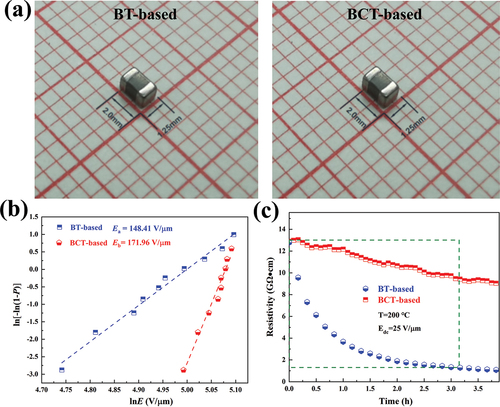
Figure 8. (a) The TSDC spectra of BT-based sample and BCT-based sample from 150 to 300 ℃ (the fixed polarization fields of 12 kV/cm, the polarization time of 10 min and the heating rate is 3 ℃/min). (b)(c) The fitting plots of lnJ v.s. 1/T of oxygen vacancies migrated from core and shell and grain boundaries at the temperature of 300 oC for BT-based sample and BCT-based sample, respectively. (d) I–V curves and (e)(f) lnJ/T2 v.s. E1/2 curves of BT-based sample and BCT-based sample.
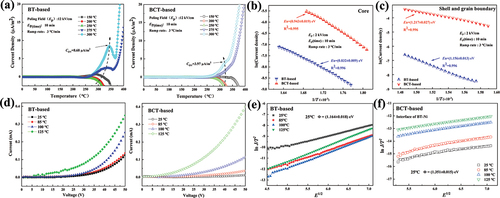
Table 1. The relaxation activation energies of TSDC curves for BT-based sample and BCT-based sample, respectively.