
Figures & data
Figure 1. Map of the H7N6 outbreak in turkey farms in the central region of Chile. Red circles indicate the two affected farms. The blue circle shows the location of the positive backyard farm depopulated SAG. Green circles indicate location, species and genes of origin viruses.
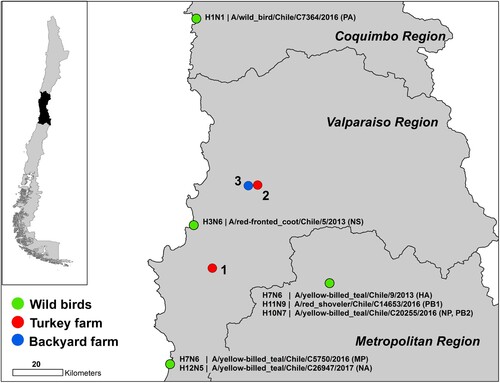
Figure 2. Maximum-likelihood phylogenic analysis of the HA and NA gene segments. Bootstrap values ≥70 indicated. Scale bars indicate average nucleotide substitutions per site. Outbreak viruses in blue, closest wild bird virus as established by pairwise sequence analysis () in red.
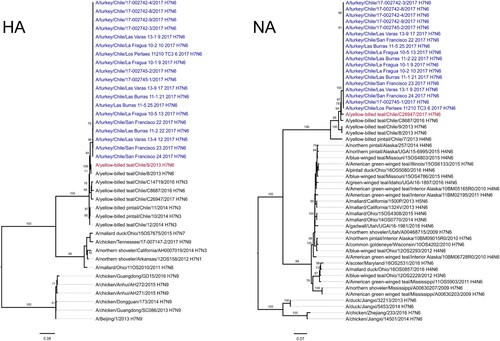
Table 1. Average nucleotide identity between gene segment of outbreak isolates and estimates of evolutionary divergence to closest wild bird viruses.
Table 2. Hemagglutination inhibition test. Outbreak viruses A/turkey/Chile/17-002745-2/2017 and A/turkey/Chile/17-002745-2/2017 in boldface. Homologous sera inhibition values in boldface and underlined.
Supplemental material