Figures & data
Figure 1. Epidemiological surveillance of seasonal human influenza in China since October 2014. Panels A and B show the epidemiological surveillance data of seasonal human influenza in northern and southern China since October 2014, respectively. In panels A and B, the bars represent the number of H3 positive samples, while the curves represent the positive rates of A/H3N2, A/H1N1, B/Yamagata and B/Victoria. Panel C shows the distribution of the 1417 strains newly sequenced in the present study.
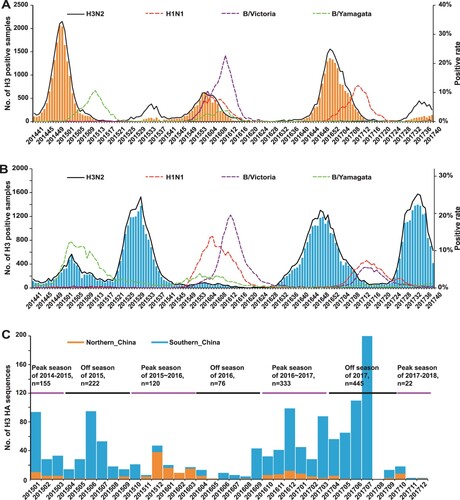
Table 1. Temporal distribution of the HA genotypes of influenza A/H3N2 virus in China.
Figure 2. Antigenic variation analysis of H3 HAs. Panel A, the five antigenic sites (epitopes A-E) are shown in H3 HA surface. The monomer of A/H3N2 HA (A/Victoria/361/2011, PDB code:4O5N) is shown. Antigenic sites A (yellow), B (cyan), C (green), D (blue) and E (pink) are coloured as indicated. The HAs from representative strains A/Texas/50/2012 (B), A/Switzerland/9715293/2013 (C), A/HongKong/4801/2014 (D), A/Singapore/INFIMH160019/2016 (E), A/Yunnan/Jinghong_1653/2017 (F), A/Guangdong/Dongguan_F20161100/2016 (G) are compared with A/Victoria/361/2011, and the distinct amino acid substitutions which lead to antigenic variation are highlighted.
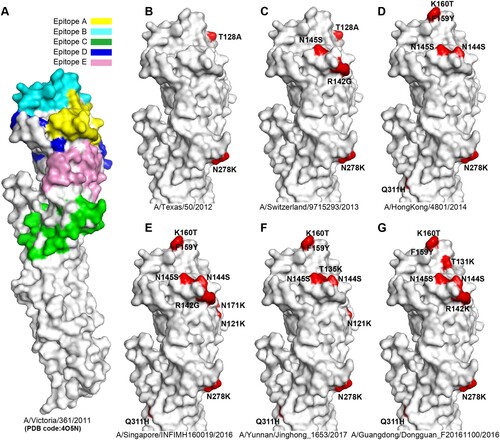
Figure 3. Genetic distances of the HA1 protein between egg-propagated vaccine strains and the circulating strains from China. The left part shows the phylogenetic tree of the HA gene sequences of the Chinese strains sampled since 2015.The five vaccine strains proposed by the WHO are highlighted in the tree and numbered with 1–5. The right panel shows the genetic distances of the HA1 protein between egg-propagated vaccine strains and the circulating strains from China, estimated using the full-length HA1 protein sequences using Phylip (Felsenstein 2004). The numbers 1–5 in the upper right corner correspond to the five vaccine strains shown in the tree in the left panel.
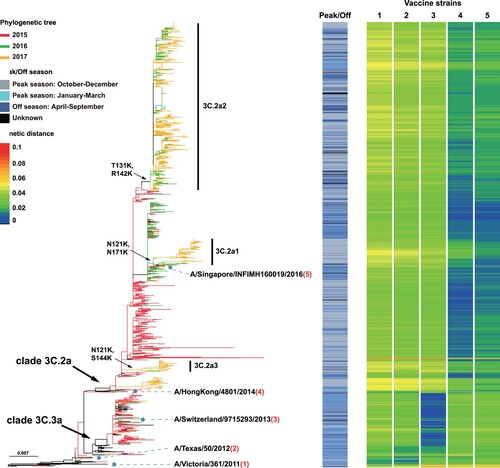
Figure 4. The average genetic distance between egg-propagated vaccine strains and the circulating strains from China across different influenza seasons. The grey bars show the proportion of genetic distances within each 0.01 interval with an increase by genetic distance of 0.01. The red lines are the Gaussian regression curve of the genetic distance. The shaded areas indicate the period of time when the vaccine was proposed to be used until the next vaccine strain is proposed.
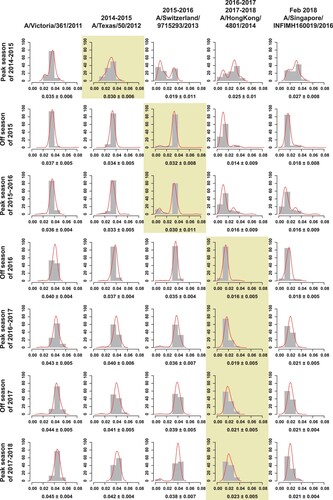
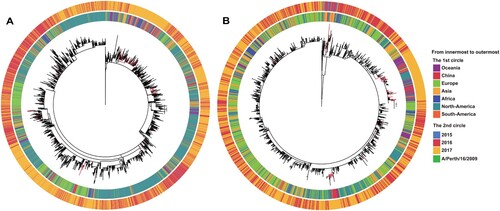
Figure 5. Phylogenetic analysis of the HA gene sequences of worldwide 121 K variants. Panel A: the 3C.2a1 subclade; panel B: the 3C.2a3subclade. The Chinese strains are highlighted in red in the two trees.