Figures & data
Figure 1. Gene organization of the E. chaffeensis p28-omp multigene locus. Genes are represented as boxes with triangles indicating their orientation. The numbers and letters above or below the boxes represent gene IDs.
Figure 2. Tr1 regulates the expression of omp-1B and p28. (A) Comparison of Tr1 orthologs in the genera Ehrlichia and Anaplasma. Identical amino acids are shaded. The helix-turn-helix DNA-binding motifs are boxed. (B) Tr1 binds to the promoters of omp-1B and p28. DNA probe (50 ng) was incubated alone (lane 1), or with 0.9, 1.8 or 3.5 µM rTr1 (lane 2–4). Shifted bands are indicated by arrowheads. (C) Identification of the sequences protected by Tr1 in the promoters of p28 and omp-1B. Left, electropherograms are superimposed to show the region protected by different concentrations of rTr1 (green, 2 µM; red, 4 µM) or BSA (blue, 4 µM) within the p28 promoter or omp-1B promoter. Right, annealed DNA probe (150 ng) was incubated alone (lane 1), or with 1.8 µM rTr1 (lane 2). Shifted bands are indicated by arrowheads. (D) Tr1 activates the expression of omp-1B and p28. DH5α strains were induced with arabinose. The fluorescence intensity was normalized against the OD600 of each strain. Data indicate means ± SD. *, P < 0.05 determined with the Student's t-test. Western blotting shows the rTr1 expression.
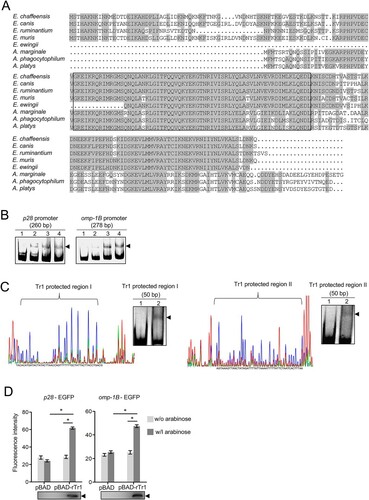
Figure 3. The tr1 expression is autoregulated. (A) Tr1 binds to the tr1 promoter. DNA probe (50 ng) was incubated alone (lane 1), or with 0.9, 1.8 or 3.5 µM rTr1 (lane 2–4). Shifted bands are indicated by an arrowhead. (B) Identification of the sequence protected by Tr1 in the tr1 promoter. Left, electropherograms are superimposed to show the region protected by different concentrations of rTr1 (green, 2 µM; red, 4 µM) or BSA (blue, 4 µM) within the tr1 promoter. Right, annealed DNA probe (150 ng) was incubated alone (lane 1) or with 1.8 µM rTr1 (lane 2). The shifted band is indicated by an arrowhead. (C) Tr1 activates the tr1 expression. DH5α strains were induced with arabinose. The fluorescence intensity was normalized against the OD600 of each strain. Data indicate means ± SD. *, P < 0.05 determined with the Student's t-test. Western blotting shows the rTr1 expression.
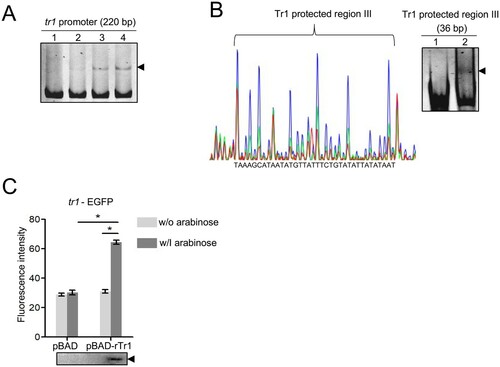
Figure 4. The consensus sequence of Tr1 binding motifs is AC/TTATA. (A) The sequences protected by Tr1 in the promoter regions of p28, omp-1B and tr1 are aligned. The numbers in black or blue indicate the position calculated from the transcriptional or translational start sites, respectively. The predicted consensus sequences of Tr1 binding motifs are boxed. (B) The annealed Tr1 protected region I or II (original or mutated) (150 ng) was incubated alone (lane 1), or with 1.8 µM rTr1 (lane 2). (C) The biotinylated Tr1 protected region I or II (100 ng) was incubated alone (lane 1), with 1 µM rTr1 (lane 2), or with rTr1 plus 50-fold excess of the corresponding unlabelled region I or II (lane 3), or mutated unlabelled region I or II (lane 4). Shifted bands are indicated by arrowheads.
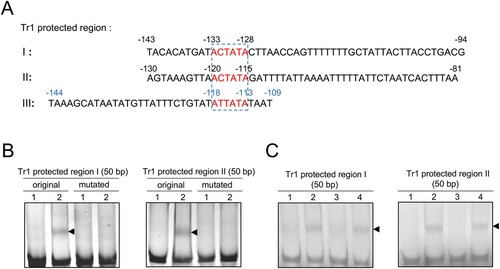
Figure 5. The tr1 expression is regulated by EcxR. (A) EcxR binds to the tr1 promoter. DNA probe (50 ng) was incubated alone (lane 1), or with 1.8 or 3.5 µM rEcxR (lane 2, 3). Shifted bands are indicated by arrowheads. (B) EcxR activates the tr1 expression. DH5α strains were induced with arabinose. The fluorescence intensity was normalized against the OD600 of each strain. Data indicate means ± SD. *, P < 0.05 determined with the Student's t-test. Western blotting shows the rEcxR expression.
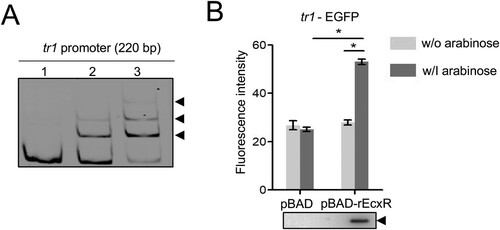
Figure 6. The expression of ecxR, tr1, p28 and omp-1B in E. chaffeensis at 25°C or 37°C. RNA samples were prepared from E. chaffeensis-infected THP-1 cells cultured at 25°C or 37°C. The expression levels of ecxR (A), tr1 (B), p28 and omp-1B (C) at different temperatures were normalized against E. chaffeensis 16S rRNA. The value of ecxR, tr1 or p28 at 25°C was set as 1, respectively. Data indicate means ± SD. *, P < 0.05 determined with the Student's t-test.
Figure 7. Tr1 has different affinities towards the promoters of p28 and omp-1B. The data indicate SPR determination of interplay between rTr1 and the Tr1 protected region I in the p28 promoter (A) or the Tr1 protected region II in the omp-1B promoter (B). ka, association rate constant; kd, dissociation rate constant; KD, the equilibrium dissociation constant. The concentrations of the proteins are indicated in the inset of the figures.
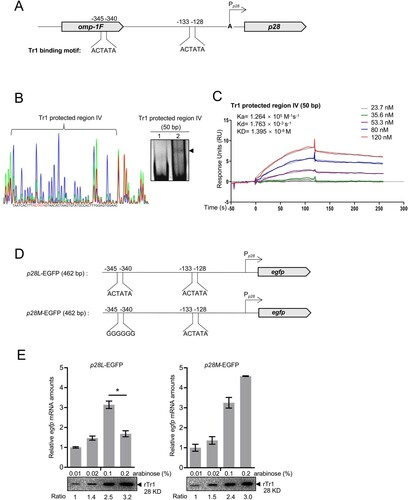
Figure 8. Tr1 binds to an additional binding site to repress the p28 expression. (A) Diagram of the Tr1 binding motifs located upstream of the p28 gene. The numbers indicate the position calculated from the transcriptional start site. (B) Identification of the sequence of the additional Tr1 binding site. Left, electropherograms are superimposed to show the region protected by different concentrations of rTr1 (green, 2 µM; red, 4 µM) or BSA (blue, 4 µM). The red letters indicate Tr1 binding motif. Right, annealed DNA probe (150 ng) was incubated alone (lane 1), or with 1.8 µM rTr1 (lane 2). The shifted band is indicated by an arrowhead. (C) The rTr1 affinity towards the Tr1 protected region IV. The data indicate SPR determination of interplay between rTr1 and the Tr1 protected region IV. ka, association rate constant; kd, dissociation rate constant; KD, the equilibrium dissociation constant. The concentrations of the proteins are indicated in the inset of the figure. (D) Diagram of the fusion constructs. The name and the inserted-fragment length are shown on the left. (E) Tr1 represses the p28 expression with the presence of Tr1 protected region IV. DH5α strains were induced with different concentrations of arabinose. The egfp expression level of each sample was normalized against E. coli 16S rRNA. Data indicate means ± SD. *, P < 0.05 determined with the Student's t-test. Western blotting was performed to determine the rTr1 amount in each sample, which was normalized against the value of OD600. The numbers below the panels indicate the relative values of the intensity of each band to that of 0.01% arabinose induction.