Figures & data
Figure 1. Maximum-likelihood phylogenetic tree of the HA gene segment of HPAI H5 sequences. Our isolates and the Russian human strain are marked by blue and red coloured circles, respectively. For the clade 2.3.4.4b H5 virus isolated in 2020, the clade origins of each gene segment are indicated by different coloured bars. A UFBoot support values of the major branch are indicated. The scale bar represents the nucleotide substitutions per site. Detailed information is available in Supplementary Materials. See also Appendix and Appendix Table 7.
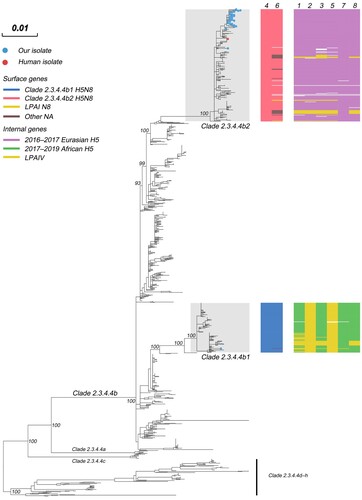
Figure 2. Maximum clade credibility (MCC) time-scaled phylogenetic tree of HA sequences of sub-clade 2.3.4.4b2 H5 virus coloured by geographic location (A), and host type (B). The branches are coloured according to the most probable ancestral geographic location, and host type. The Russian human strain is denoted by red arrows. The root state posterior probabilities are shown in each inset panel.
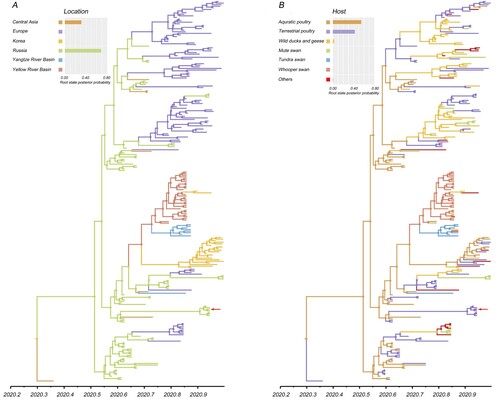
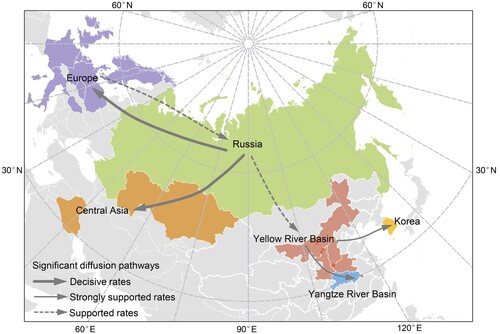
Figure 3. Spatial diffusion of the HA gene segment of the sub-clade 2.3.4.4b2 H5 virus. The red dots indicate the sampling site in central China. The bold grey arrow indicates decisively supported diffusions (BF ≥ 1000); solid grey arrows, strongly supported diffusions (10 ≤ BF < 100); and dashed grey arrows, supported diffusions (3 ≤ BF < 10).