Figures & data
Table 1. Oligonucleotides used to generate mutant C. parapsilosis isolates carrying TAC1L518F and FKS1E1393G.
Figure 1. Expression profile of ERG11 (A), MDR1 (B), and CDR1 (C) from a selected number of C. parapsilosis isolates (n = 8) after exposure to fluconazole, which showed that fluconazole-resistant isolates (FLZR) significantly overexpressed CDR1 relative to susceptible ones. C. parapsilosis isolates grown at logarithmic phase were subjected to one dilution below MIC of fluconazole for 90 min, and after RNA extraction, relative gene expression was assessed as described in methods section.
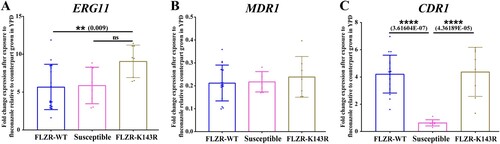
Table 2. Minimum inhibitory concentration of antifungal agents used against Candida parapsilosis isolates (n = 60). The number of isolates for each concentration of a given drug is indicated.
Table 3. The characteristics of Candida parapsilosis isolates selected for sequencing and gene expression analysis. The expression profile values of the genes studied are based on the average ± standard deviation.
Figure 2. The expression profile of CDR1 for parental strain ATCC 22019 and its mutants carrying L518F in Tac1 and the micafungin tolerance of ATCC 22019 and it mutant carrying E1393G in Fks1. Mutants carrying TAC1L518F (from two independent mutants) had a significantly higher basal expression of CDR1, which was not induced upon fluconazole exposure (A and B). Mutants carrying FKS1E1393G had a significantly higher tolerance to micafungin (4 µg/ml), which shows the average of two independent mutants.
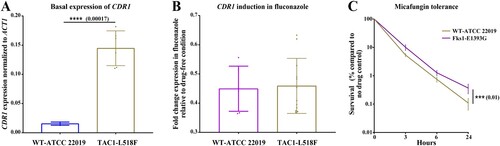
Table 4. The minimum inhibitory concentration of antifungal drugs against the mutants carrying L518F in Tac1 and E1393G in Fks1 and their parental wild-type (WT) strain.
Figure 3. Minimum spanning tree of C. parapsilosis isolates.
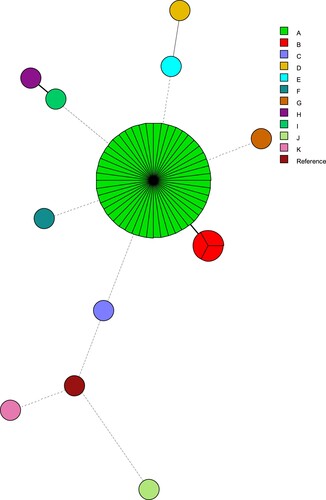
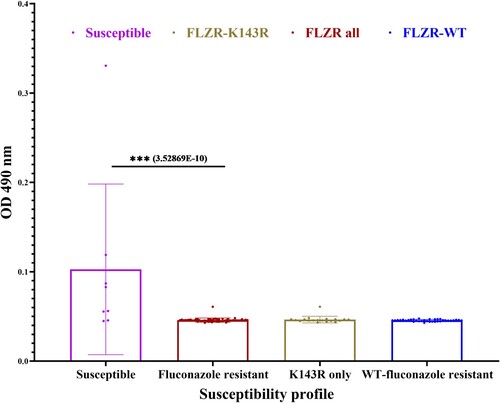
Figure 4. Biofilm formation of fluconazole resistant (FLZR-WT and FLZR-K143R) and fluconazole susceptible isolates. The Y-axis represents biofilm production as a function of absorption at OD490.