Figures & data
Figure 1. Combinatorial library building pipeline and free-energy perturbations (FEP) analysis. The pipeline used for FEP de novo design of non-peptide compounds targeting the catalytic site of 3CLpro. The core of fragment C1 was used as a starting point for the design of new compounds by substituting and combining various groups in the different subpockets. Docking of the active fragment, C1 (teal sticks) in SARS-CoV-2 3CLpro (7KHP) and active derivatives was performed and the Glide docking scores of the derivatives were determined. The Δ predicted affinity (ΔPred Aff) represents the predicted changes in binding affinities (in kcal/mol) over the parental compound C1. The more negative the value, the more improved the derivative is predicted to be.
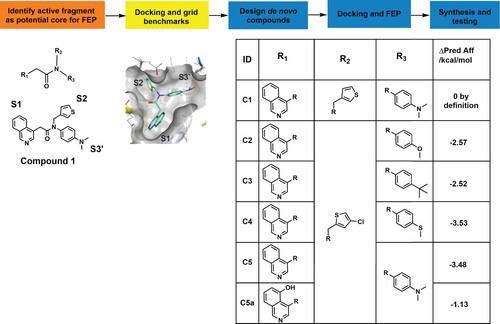
Figure 2. Novel 3CLpro molecules (C2–C5a) inhibit the endoproteolytic activity of SARS-CoV-2 3CLpro in vitro and in cellulo. (A-E) The proteolytic activity of purified recombinant 3CLpro was measured using the IQFS in the presence of increasing concentrations of selected candidate compounds (C2–C5a). (F-J) The inhibitory Kd measures were performed by microscale thermophoresis (MST). (K-O) Caco-2 cells were transduced with vectors to express the recombinant SARS-CoV-2 3CLpro and 3CLglow biosensor following treatment with serial dilution concentrations of C2–C5a (black circles) and the toxicity is reported by biosensor RFP (open circles). Fluorescence intensity was measured with a CellInsight CX7 High Content Screening System. The GraphPad Prism 9™ (GraphPad Software, Inc.) nonlinear regression was used for IC50 curve-fitting (n = 3).
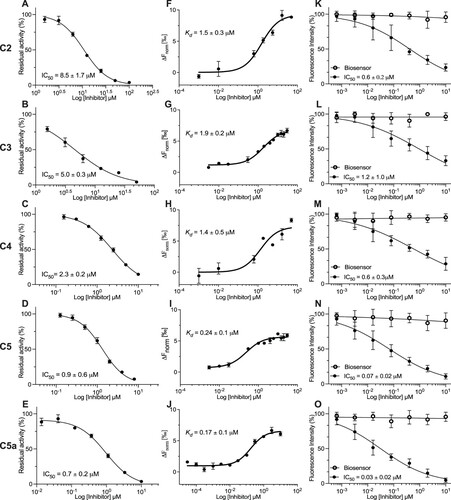
Figure 3. The binding mechanism for the non-covalent, non-peptide inhibitor series C2–C5 of SARS-CoV-2 3CLpro. (A) Interaction schematic for inhibitor series C2–C5 showing interactions for a common scaffold. Hydrogen bonds are shown as blue dashed lines, hydrophobic interactions as green dashed lines, and pi-stacking interactions as black dashed lines. The varied groups (R) are shown on right. (B) Dimeric 3CLpro (7KHP) with one monomer shown as cartoon coloured from the N- (blue) to C-terminus (red); the other monomer is shown as a grey surface with the active site boxed. (C) Zoomed-in active site from B showing bound inhibitor series C2–C5, colours indicated in (A). A model of the 3CLpro C-terminal auto-cleavage sequence is superimposed and shown as lines with carbon black, nitrogen blue, and oxygen red. Subsites S1, S2, and S3’ are labelled.
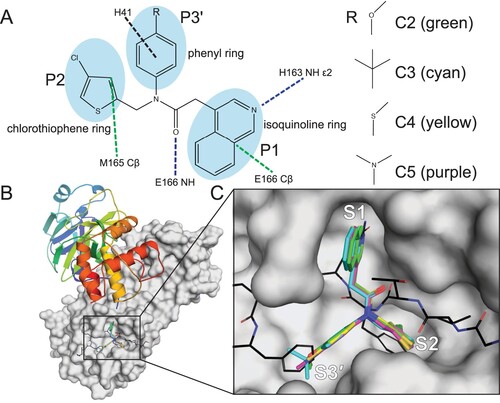
Figure 4. Comparison of the electrostatic potential interaction surface for C5 (A) and C5a (B) and Asn142 after low-mode molecular dynamics (C). Both compounds are modelled in the AMBER14:EHT forcefield, using their respective crystal structures as starting points (C5: 8CYU, C5a: 8SXR). For both compounds, Asn142 forms a pi-pi stacking interaction in the same orientation. The surfaces have been coloured blue for positive, red for negative, and white for neutral. Arrows highlight the differences in interaction potential as seen by Asn142. The increased polarity of the C5a isoquinoline system and its alignment with the electronegative surface of Asn142, combined with a new hydrogen donation from the chiral proton of Ser46 to the electron-rich dimethyl amino system, likely account for the increased affinity observed. (C) Superposition of crystal structures 8CYU and 8SXR with residue and subsite labelling. The Asn142 moves ∼1 Å to permit better interaction with C5a.
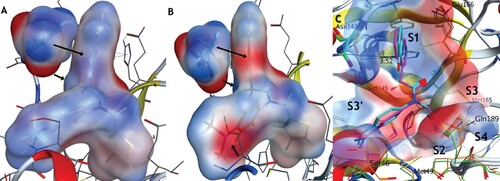
Figure 5. C5a blocks infection of the SARS-CoV-2 BA.5 variants of concern in human lung (Calu-3) and colon cells (Caco-2). (A) Representative fluorescent images of human Calu-3 and Caco-2 cells infected with SARS-CoV-2 BA.5, following treatment with the indicated concentrations of C5a, C5, and C7/nirmatrelvir. Control images of infected untreated (DMSO) and uninfected (Mock) cells are shown at the bottom. Hoechst is shown in blue, nucleocapsid in red, and dsRNA in green. Images were captured with a CellInsight CX7 High Content Screening System with a 10X objective lens. (B-G) Dose-response curves were generated for C5a, C5, and C7/nirmatrelvir in Calu-3 cells (B-D) and Caco-2 cells (E-G) infected with SARS-CoV-2 BA.5 using dsRNA (green square) and nucleocapsid (red circle) as infection markers (n = 3).
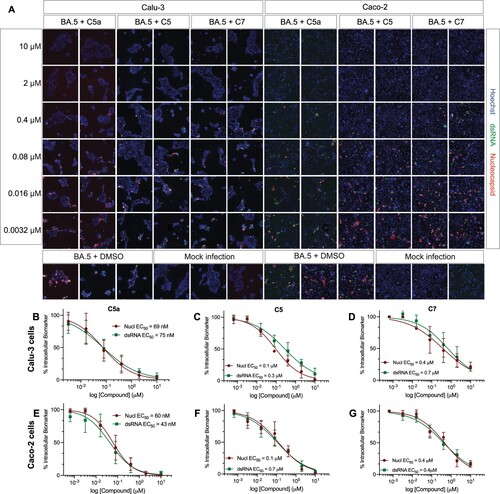
Figure 6. C5a blocks infection of the SARS-CoV-2 BQ.1.1 Omicron subvariant in human lung (Calu-3) and colon cells (Caco-2). (A) Representative fluorescent images of human Calu-3 and Caco-2 cells infected with SARS-CoV-2 BQ.1.1 following treatment with the indicated concentrations of C5a, C5, and C7/nirmatrelvir. Control images of infected untreated (DMSO) and uninfected (Mock) cells are shown at the bottom. Hoechst is shown in blue, nucleocapsid in red, and dsRNA in green. Images were captured with a CellInsight CX7 High Content Screening System with a 10X objective lens. (B-G) Dose-response curves were generated for C5a, C5, and C7/nirmatrelvir in Calu-3 cells (B-D) and Caco-2 cells (E-G) infected with SARS-CoV-2 BQ.1.1 using dsRNA (green square) and nucleocapsid (red circle) as infection markers (n = 3).
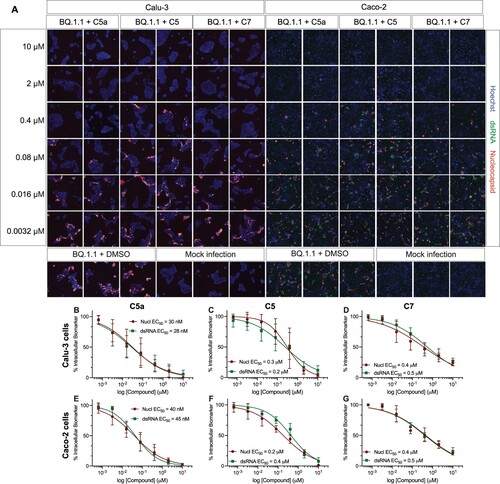
Figure 7. C5a blocks infection of the SARS-CoV-2 XBB.1.5 Omicron subvariant in human colon cells (Caco-2). (A) Representative fluorescent images of Caco-2 cells infected with SARS-CoV-2 XBB.1.5 following treatment with the indicated concentrations of C5a, C5, and C7/nirmatrelvir. Control images of infected untreated (DMSO) and uninfected (Mock) cells are shown at the bottom. Hoechst is shown in blue, nucleocapsid in red, and dsRNA in green. Images were captured with a CellInsight CX7 High Content Screening System with a 10X objective lens. (B–D) Dose-response curves were generated for C5a, C5, and C7/nirmatrelvir in Caco-2 cells infected with SARS-CoV-2 XBB.1.5 using dsRNA (green square) and nucleocapsid (red circle) as infection markers (n = 3).
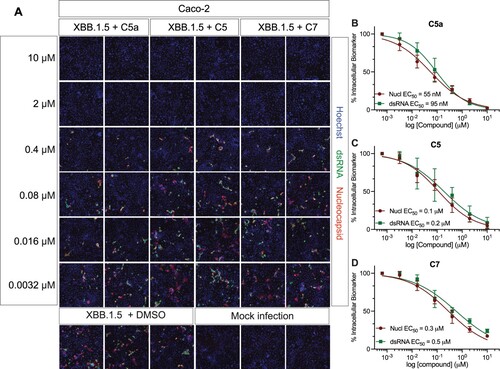
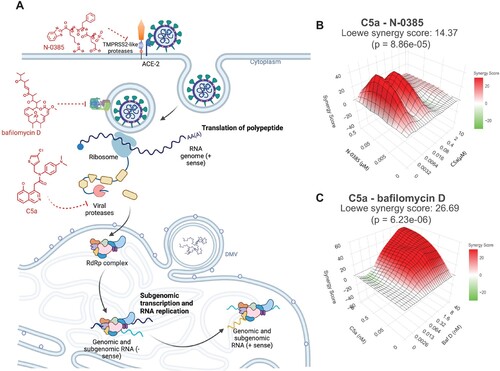
Figure 8. Synergistic inhibition of SARS-CoV-2 Omicron BA.5 infection in human lung cells (Calu-3) by combined use of C5a and N-0385 or bafilomycin D. (A) Overview of drug target in virus cycle. (B-C) Dose-response curves of inhibition of single and combined treatment of C5a and N-0385 or bafilomycin D in SARS-CoV-2 infected Calu-3 cells were used for synergy analysis using the open-source web application SynergyFinder. 3D visualization synergy maps of C5a with N-0385 (B) or bafilomycin D (C), were calculated using the Loewe additive model. The surface is color-coded: red indicates synergistic interactions and green indicates antagonistic interactions (n = 2).