
Figures & data
Figure 1. Phylogenetic analysis of HA genes of H9N2 subtype AIV from 2010 to 2020 in China. The maximum clade credibility (MCC) tree of HA gene of H9N2 subtype AIVs from 2010 to 2020 in China. Phylogenetic tree with tip names is depicted in Supplementary Figure S1. Detailed information and clades of viruses in the constructed phylogenetic trees are listed in Supplementary Table S2. Vertical lines with a number indicate the clade partitioned in this study. Different colours represented different clades.
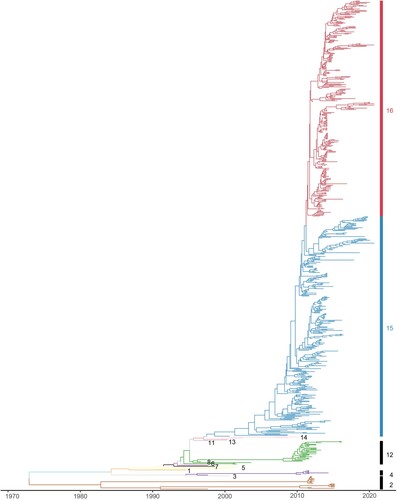
Figure 2. The bar plot indicated the proportion of H9N2 strains from clade15 and clade16 used in this study by year, respectively. The proportion of isolated strains from clade15 was coloured in blue, and the proportion of isolated strains from clade16 in red.
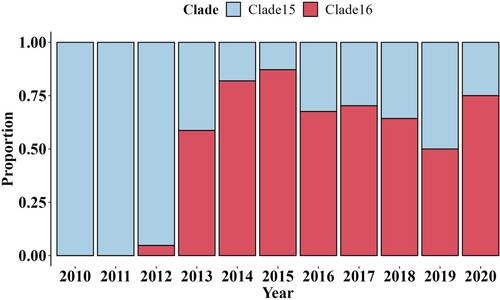
Figure 3. The antigenic cartography of represented H9N2 strains. The represented strains, which were selected in different clades from 1998 to 2020, were coloured differently according to clades and labelled with isolation year and virus name. Clade5 was represented by purple. Clade12 was represented by orange. Clade14 was represented by yellow. Clade15 and Clade16 were represented by blue and red, respectively. The spacing of the grid lines of y axis was equivalent to antigenic unit distance, which corresponds to a two-fold HI difference. All represented strains were divided into 3 groups based on the K-means clustering algorithm and enriched in an oval coloured differently according to antigenic groups.
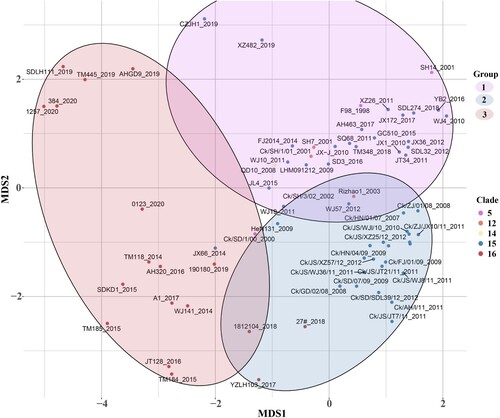
Figure 4. Different amino acid sites in HA1 between clade15 and clade16. The first column represents the clade of each strain, where clade15 was coloured in blue and the clade16 was coloured in red. Other columns represented different amino acid identity with different colours in each site.
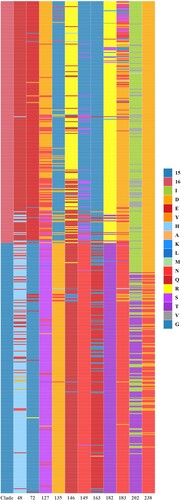
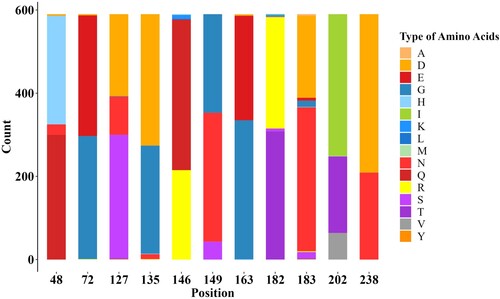
Figure 5. Stacked bar chart within 11 potential antigenic amino acid residues of 590 HA sequences from Clade 15 and Clade 16 strains. The y-axis (count) represents the counts of amino acids at each position in the sequence alignment. The colour of letter represents type of specific amino acid at this position.
Supplemental Material
Download MS Excel (41.7 KB)Supplemental Material
Download MS Excel (14.2 KB)Supplemental Material
Download MS Excel (17.9 KB)Supplemental Material
Download MS Excel (9.8 KB)Supplemental Material
Download MS Excel (43.5 KB)Supplemental Material
Download MS Excel (12.4 KB)Supplemental Material
Download JPEG Image (1.5 MB)
Supplemental Material
Download PDF (655.8 KB)Supplemental Material
Download PDF (556 KB)Data availability
Accessions with relevant metadata are contained in Supplemental Tables S1 andS2, and the sequences are available on Gisaid. Results of HI tests are contained in Supplemental Table S3. Scripts for generating figures are available upon request.