Figures & data
Figure 1. Infectivity of pseudotyped lentiviruses bearing XBB.2.3 or EG.5.1 spike into HEK293T-ACE2 and CaLu-3 cells. (A) Schematic relationship between XBB-lineage variants in this study. Arrows denote direct relationships between variants with the corresponding spike mutations written along them. (B and C) Pseudotyped lentiviruses bearing each of the depicted spikes of interest were produced in HEK293T cells and used to infect (B) HEK293T-ACE2 or (C) CaLu-3 cells. Bars in (B and C) represent means ± standard deviation for 3 replicates represented by individual dots (n = 3). All statistical comparisons were made relative to D614G. p values are displayed as ∗p < 0.05, ∗∗∗p < 0.001, ∗∗∗∗p < 0.0001 and ns p > 0.05.
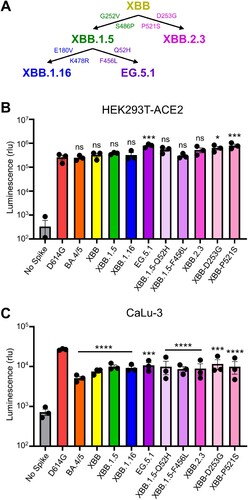
Table 1. Bivalent vaccinated HCW, BA.4/5-wave first responder, and XBB.1.5-wave first responder cohort information.
Figure 2. Neutralizing antibody titers against XBB.2.3 and EG.5.1 for bivalent vaccinees, BA.4/5-convalsecent cohort, and XBB.1.5-convalsecent cohort. Pseudotyped lentiviruses bearing each of the spikes of interest were used to perform virus neutralization assays with three cohorts of sera; (A-B) individuals that received at least two doses of monovalent mRNA vaccine and 1 dose of bivalent mRNA vaccine (n = 14), (C-D) individuals that were infected during the BA.4/5-wave of COVID-19 in Columbus, OH (n = 20); (E-F) individuals that were infected during the XBB.1.5-wave of COVID-19 in Columbus, OH (n = 8). (A, C, E) Plots depict individual neutralizing antibody titers displayed as neutralization titers at 50% (NT50). Bars represent geometric means with 95% confidence intervals. Numbers on top of the plots represent the geometric means for each variant. Significance values are determined relative to BA.4/5, ancestor of these XBBs, using log10 transformed NT50 values to better approximate normality. (B, D, F) Heatmaps that depict the NT50 values for (B) the bivalent vaccinated cohort, (D) the BA.4/5-convalescent cohort, and (F) the XBB.1.5-convalscent cohort. Asterisks in (D and F) indicate the individuals who had received at least three doses of monovalent mRNA vaccine before infection. Hashtags in (F) indicate individuals that received at least 3 doses of monovalent mRNA vaccine and 1 dose of bivalent booster and upward arrow (^) in (F) indicates the individual that received two doses of monovalent mRNA vaccine. p values are displayed as ∗p < 0.05, ∗∗p < 0.01, ∗∗∗p < 0.001, ∗∗∗∗p < 0.0001 and ns p > 0.05.
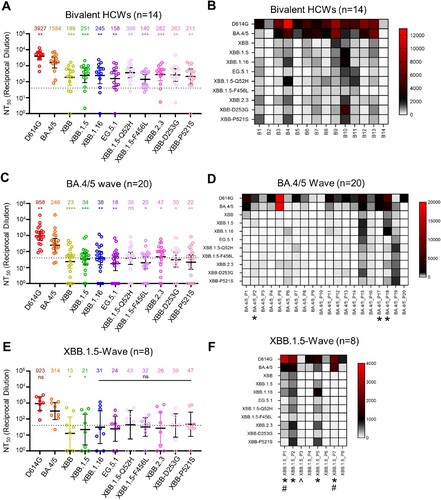
Figure 3. Neutralization of monoclonal antibody S309 against XBB.2.3 and EG.5.1. Pseudotyped lentiviruses bearing each of the spikes of interest were used in a virus neutralization assay with the class III monoclonal antibody S309. (A) Plot curve of S309 neutralization and (B) a table showing the calculated IC50 values best fit to the curve with the 95% confidence interval are depicted. The dashed line in (A) marks 50% relative infectivity.
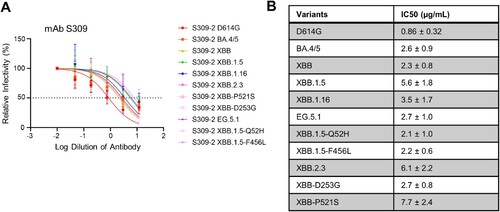
Figure 4. Modeling of the F456L mutation at interface with ACE2 and mAbs S309 and S2E12. Homology modeling was used to simulate the effects of the F456L mutation present in the EG.5.1 spike on (A) binding of class III monoclonal antibody S309, (B) binding of class I monoclonal antibody S2E12, and (C) ACE2 binding. (A) Spike RBD is depicted in cyan and mAb S309 is depicted in orange and yellow. Key spike mutations of EG.5.1 in positions F456 and P521 are highlighted in red. Glycan epitope for S309 on is depicted as grey space-filling spheres. (B) EG.5.1 spike is represented in cyan and mAb S2E12 in purple and yellow. Residue F456L is represented in the center with distances to residues Val52 and Gly54 represented by black dashed lines. (C) EG.5.1 spike is represented dark green overlaid D614G spike in cyan. The F456L mutation is highlighted in red. ACE2 is represented in green.
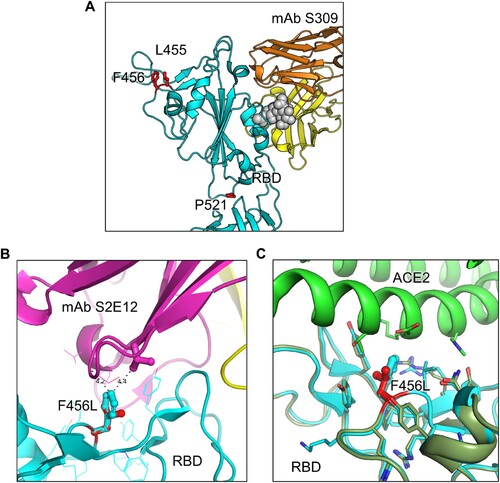
Figure 5. Fusogenicity, expression, and processing of XBB.2.3 and EG.5.1 spikes. (A and B) Fusogenicity of spikes were determined by co-transfecting HEK293T-ACE2 cells with GFP and the spike of interest and imaging the extent of fusion 18 h post-transfection using fluorescence microscopy. (A) Representative images were selected and (B) average areas of fusion quantified for each spike. Bars represent means ± standard error, and dots represent three random areas for each replicate. Significance relative to D614G was determined using a one-way repeated measures ANOVA with Bonferroni’s multiple testing correction (n = 3). “No Spike” refers to the negative control which was transfected with GFP and empty pcDNA3.1 plasmid. ∗∗∗∗ p < 0.0001. (C) Expression of spike was determined by performing surface staining (anti-S1 polyclonal antibody) and flow cytometry on HEK293T cells used to produce pseudotyped lentiviruses. A triplicate was performed, and a representative overlaid histogram was selected and depicted in (C). (D) The processing of each spike was determined by lysing HEK293T cells transfected with spike of interest and performing western blotting. Blots were probed with anti-S2 and anti-GAPDH (loading control), respectively. Processing of spike was quantified using Image J to determine relative band intensities for full length spike versus S2 and a resulting S2/S ratio was calculated. Ratios are listed below each corresponding set of bands. Ratios were normalized to D614G (D614G = 1.0).
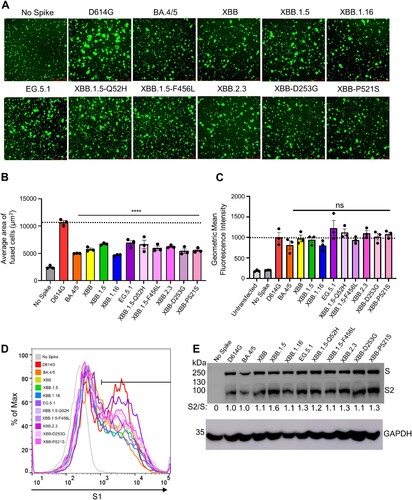
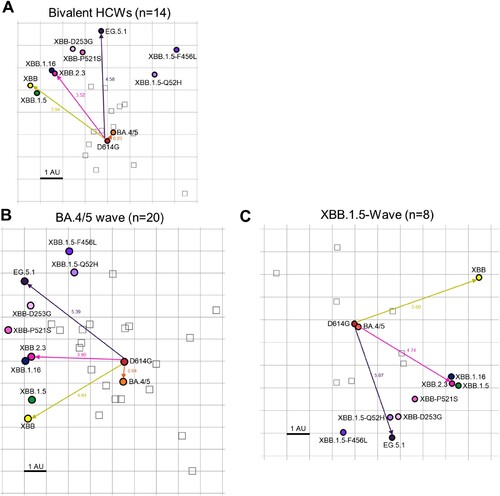
Figure 6. Antigenic mapping of neutralization titers for bivalent vaccinated, BA.4/5-wave infected, and XBB.1.5-wave infected cohorts (associated with ). The Racmacs programme (1.1.35) was used to generate antigenic maps for neutralization titers from (A) the bivalent vaccinated, (B) the BA.4/5 wave infected, and (C) the XBB.1.5-wave infected cohorts. Circles represent the variants and squares represent the individual sera samples. Arrows between D614G and selected variants are labeled with the distance between those variants in antigenic units (AU). One square on the grid represents one antigenic unit squared.