Figures & data
Figure 1. Latency (a) and probe test (B) of Wistar rats treated with Pb, AD + Pb and DMSA + Pb. # indicates significant difference with the control group at P < 0.05, (n = 4)
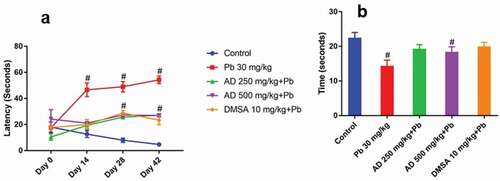
Figure 2. Composite photomicrograph of CA1 and CA3 hippocampal subfields of the brain of rats treated with Pb, AD + Pb and DSMA + Pb showing normal pyramidal cells in A and F, mild distortion in C, E and H and necrosis and neuronal loss in B, D, G, I and J. H and E × 400
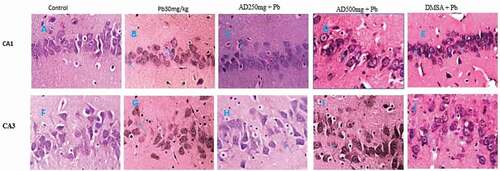
Figure 3. Composite photomicrograph of CA1 and CA3 hippocampal subfields of the brain of rats treated with Pb, AD + Pb and DSMA + Pb showing normal pyramidal cells in A and F, mild distortion in C, D and E and degeneration and neuronal loss in B, G, H, I and J. Bielschowsky x 400
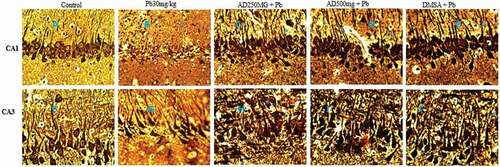
Figure 4. Glutamate concentration in the brain tissue of rats treated with Pb, AD + Pb and DMSA + Pb. # indicates significant difference with the control group at P < 0.05, (n = 4)
Figure 5. MDA level in the brain tissue of rats treated with Pb, AD + Pb and DMSA + Pb. # indicates significant difference with the control group at P < 0.05, (n = 4)
Figure 6. Catalase, glutathione peroxidase and superoxide dismutase activities in brain homogenate of Pb, AD +Pb and DMSA + Pb treated rat. # indicates significant difference with the control group at P < 0.05, (n = 4)