Figures & data
Figure 1. Bar charts of the liver enzymes parameters ((a) ALP, (b) AST, and (c) ALT) after 4 weeks of the experiment. Data were analyzed using one way ANOVA, followed with Tukey post hoc test. *P < 0.033; ** P < 0.002; *** P < 0.0001 indicates a significant difference when compared to normal control; #P < 0.03; ## P < 0.002; ### P < 0.0001, indicates a significant difference when compared to HgCl2 control group.
Figure 2. Bar charts of kidney function parameters ((a) urea, and (b) creatinine) after 4 weeks of the experiment. Data were analyzed using one way ANOVA, followed with Tukey post hoc test. *P < 0.033; ** P < 0.002; *** P < 0.0001 indicates a significant difference when compared to normal control; #P < 0.03; ## P < 0.002; ### P < 0.0001, indicates a significant difference when compared to HgCl2 control group.
Figure 3. Bar charts of Oxidative stress parameters ((a) SOD, (b) CAT, (c) GSH and (d) MDA) after 4 weeks of the experiment. Data were analyzed using one way ANOVA, followed with Tukey post hoc test. *P < 0.033; ** P < 0.002; *** P < 0.0001 indicates a significant difference when compared to normal control; #P < 0.03; ## P < 0.002; ### P < 0.0001, indicates a significant difference when compared to HgCl2 control group.
Figure 4. Composite photomicrographs of liver of control (a) showing normal hepatocytes (arrow) and central vein (CV), HgCl2 treated micrograph (b) exhibited remarkable degenerating hepatocyte (green arrow), and fat hepatocellular vacuoles (Asterix). Extract 25 mg/kg + 0.5 mg/kg HgCl2 (c) showed mild inflamed hepatocyte (green arrow) and mild dilatation of the sinusoid (blue arrow), Extract 50/75 mg/kg + 0.5 mg/kg HgCl2 (d & e) showing normal hepatocyte (arrow), Ascorbic Acid treated group (f), showed mild dilatation of the sinusoid (blue arrow), and mild inflamed hepatocyte (green arrow).
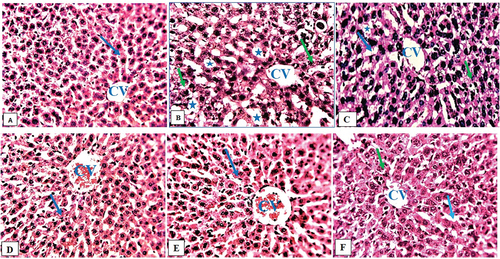
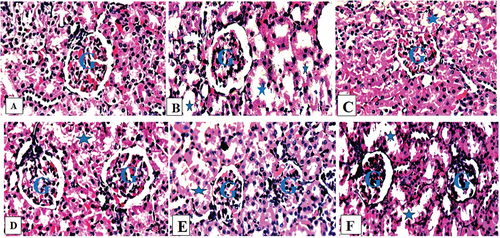
Figure 5. Composite photomicrographs of kidney of control (a) showing a normal glomerulus (G) and renal tubules, HgCl2 treated micrograph (b) exhibited degenerated renal tubules (Asterix), with a mild retracted glomerulus (G), Extract 25 mg/kg + 0.5 mg/kg HgCl2 (c) showed a mild obliterative form glomerular space (G) with mild degenerated renal tubule (Asterix), Extract 50/75 mg/kg + 0.5 mg/kg HgCl2 (d & e) showing very normal rental tubules (Asterix) and a normal glomerulus (G), Ascorbic Acid treated group (f), exhibited mild obliterative form of glomerulus (G).