Figures & data
Figure 1. The means of body weight and kidney weight among the different studied groups. #: significance between control and diabetic-group, @: significance between diabetic-group and diabetic +AE group.
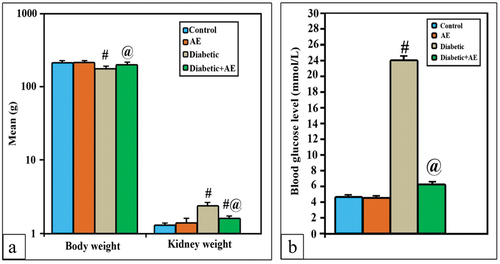
Figure 2. levels of serum urea, creatinine and uric acid among the different studied groups. #: significance between control and diabetic-group, @: significance between diabetic-group and diabetic +AE group.
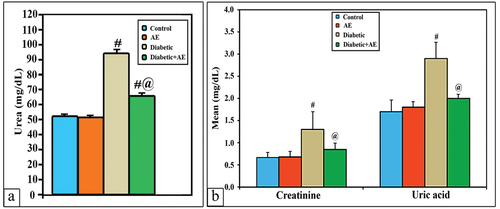
Figure 3. The levels of serum β2-microglobulin, NGAL, IL-1β, plasma KIM-1, ceruloplasmin, and VEGFamong the different studied groups. #: significance between control diabetic-group, @: significance between diabetic-group and diabetic +AE group.
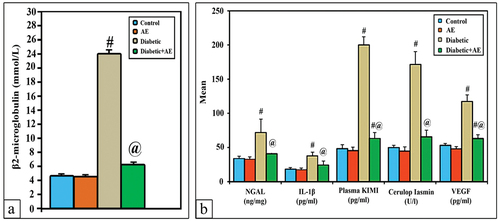
Figure 4. The levels of serum lipid profiles (Ttr, TC, LDL and HDL) and kidney antioxidants (SOD, GSH, MDA, CAT and, GPx) among the different studied groups. #: significance between control and diabetic-group, @: significance between diabetic-group and diabetic +AE group.
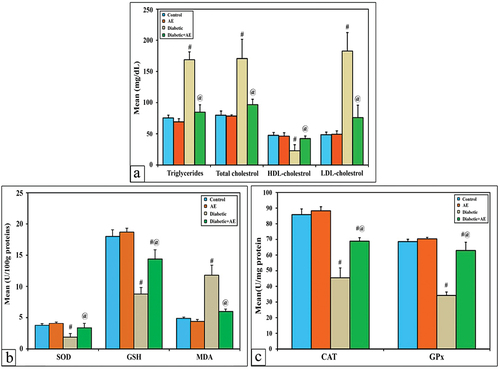
Figure 5. Kidney histological images from the control (a), AE (b), STZ (c–d), and STZ+AE (e–f) groups of rats. In STZ-induced diabetic rats, the sections showing atretic or lytic (read arrow heads), hypertrophied (red star), damaged tubular epithelial cells with relatively wide lumens (black arrow heads), thickened wall capillaries (white arrow heads), and scattered infiltrated cells (white asterisks). In the diabetic and AE groups, the glomerular and tubular architectures show remarkable amelioration. Abbreviations: BC: Bowman’s capsule; BS: Bowman’s space; CD: collecting duct; G: glomerulus; DT: distal tubule; and PT: proximal tubule. (Stain: H&E, scale bar: 100µm).
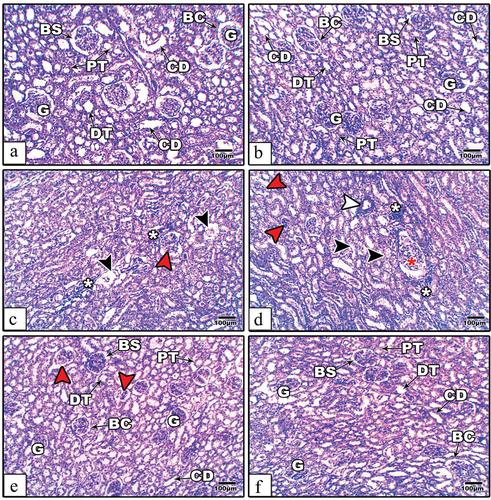
Figure 6. Images of kidney sections from control (a), AE (b), STZ (c), and STZ+AE (d) stained with PCNA antibody. The immunohistochemical expression of PCNA appears strong in the glomerular and tubular cells of the control and AE groups, very weak in the diabetic group, and moderately expressed in the diabetic and AE groups. Panel (e) indicates the quantitative analysis (using image analysis) for the percentage of PCNA expressed kidney cells among investigated groups. The arrowheads point to PCNA immunoreactivity. (PCNA antibody stain, scale bar: 25µm).
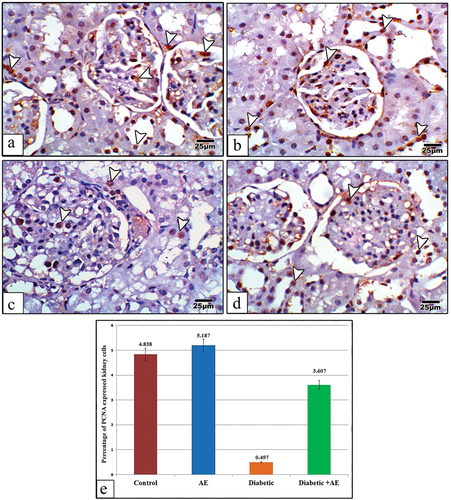
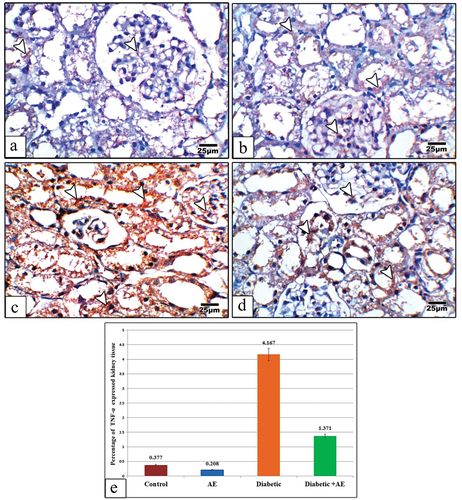
Figure 7. Images of kidney sections from control (a), AE (b), Diabetic (c), and Diabetic +AE (d) stained with TNF-α antibody. The immunohistochemical expression of TNF-α appears negative or very weak in the glomerular and tubular cells of the control and AE groups, strong in the diabetic group, and moderately expressed in the diabetic and AE groups. Panel (e) illustrates the quantitative analysis (using image analysis) for the percentage of TNF-α expressed kidney cells among investigated groups. The arrow heads point to the TNF-α immunoreactivity. (TNF-α antibody stain, scale bar: 25µm).