
Figures & data
Figure 1. Various defects in rail head: (a) an indentation caused by a steel ball from an aerosol paint can, (b) an indentation by unknown object, and (c) a defect of unknown cause.
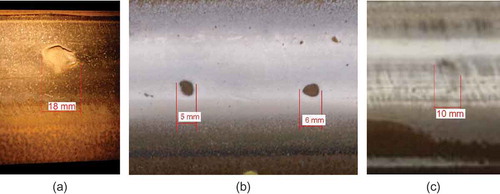
Figure 2. The FE vehicle–track interaction model. (a) 3D view and (b) longitudinal–vertical view.
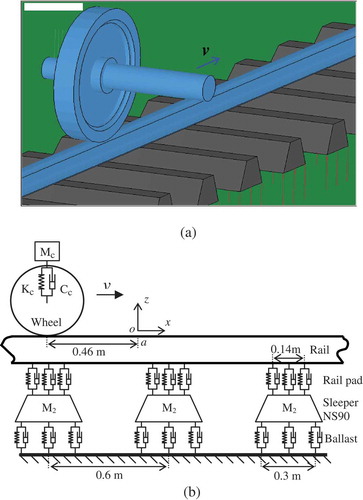
Figure 3. Rail top longitudinal–vertical profiles measured along the centre of rail head at two small defects. The measurement data point interval is 5 mm. The curves are not smoothed.
Figure 4. The shape and dimension of the generalized defects. (a) Profiles at the deepest longitudinal–vertical cross-section and (b) profiles at the deepest lateral–vertical cross-section.
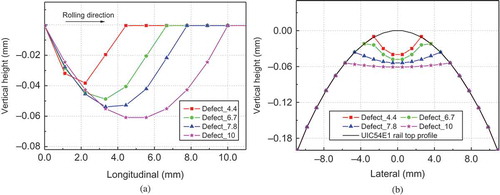
Table 1. The values of the parameters in the model.
Figure 5. The 3D appearance of Defect_10 when it is applied to the rail head. (a) Defect with 10× magnification in vertical direction and (b) defect without magnification. Note in (a) the magnification is applied only to the defect, not to the rest of the rail top surface, the scale of the ordinate remains therefore unchanged.
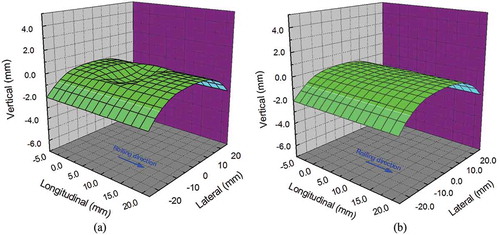
Figure 6. The transition process along the longitudinal axis of the contact patch (y = 0) at Defect_10. (a) The pressure and (b) the surface shear stress.
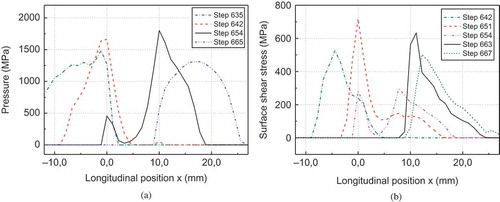
Figure 7. The tangential surface stress distribution in a contact patch under the same pressure when friction coefficient changes.
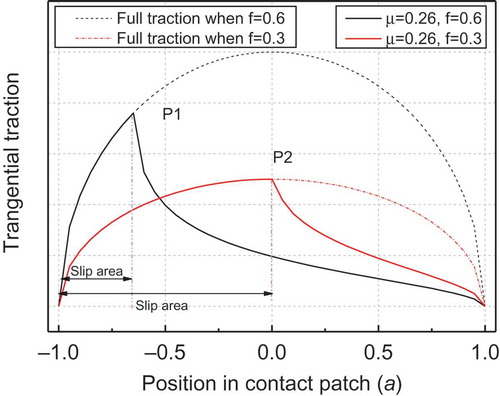
Figure 8. The 3D stress distribution at Defect_10. (a) The pressure distribution at step 654 and (b) the surface shear stress distribution at step 663.
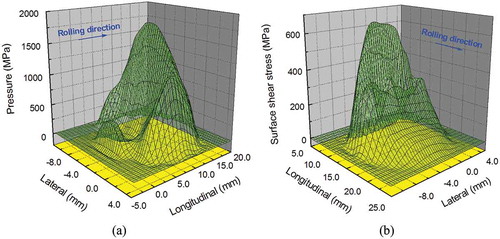
Figure 9. The slip and adhesion areas at step 654.
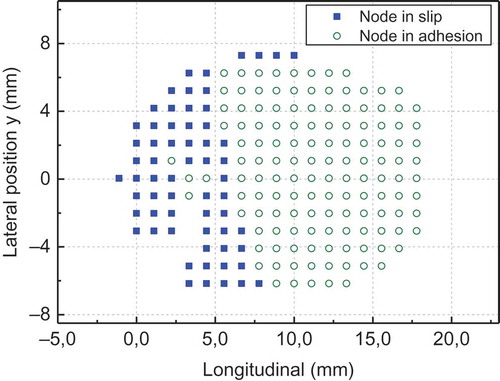
Figure 10. The Maximal v-M stress distributions along the depth in the rail at the defects with different COF (f) and traction coefficient (µ). Origin of the abscissa is at the rail top surface. The results for ‘smooth’ are obtained from the rail without defects.
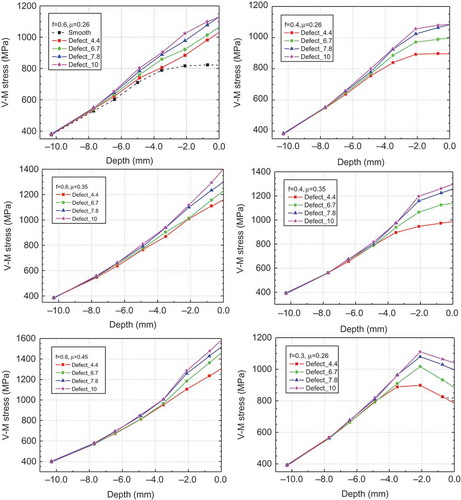
Figure 11. Influence of friction coefficient and traction coefficient on the maximal v-M stress for Defect_6.7. (a) The influence of traction coefficient and (b) the influence of friction coefficient.
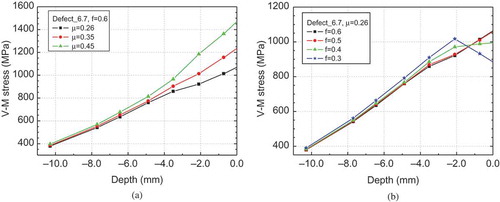
Figure 12. The local curvature variation at the trailing edge of Defect_6.7.
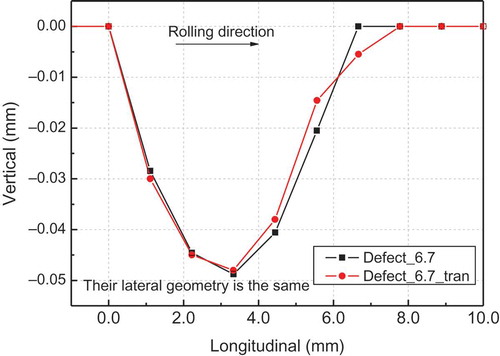
Figure 13. The maximal stress along depth at different defects. Depth = 0.0 is at rail surface.
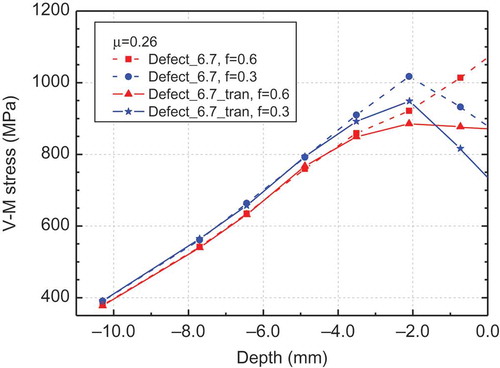
Figure 14. The generalized profiles of defects in the longitudinal–vertical section, the trailing edges of which are assumed to be smoothed by plastic deformation due to wheel passages. The leading edges are the same as those of .
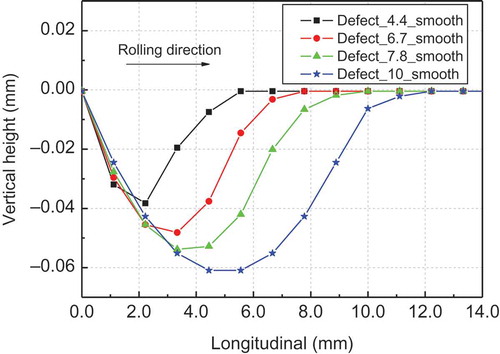
Figure 15. The Maximal v-M stress distribution at defects under different friction coefficient (f) and traction coefficient (). Origin of the abscissa is at the rail top surface.
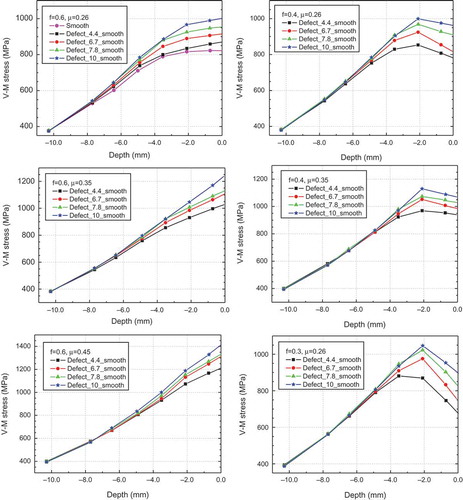
Table 2. The maximal surface v-M stress (unit: GPa) µ = 0.26.
Table 3. Influence of different smoothed profiles (= 0.26, unit: GPa).
Figure 16. Comparison of two smoothed defect profiles.
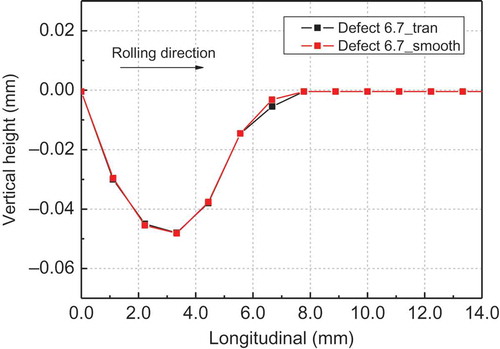
Figure 17. Validation of the critical size. (a) Two defects of 5 and 6 mm were erased by wear, and (b) a defect of 10 mm had grown into a moderate squat with the typical V form.
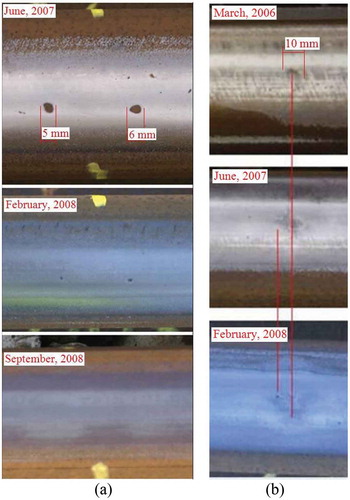
Figure 18. Validation of the critical size. A defect of original length 11 mm or so grew.
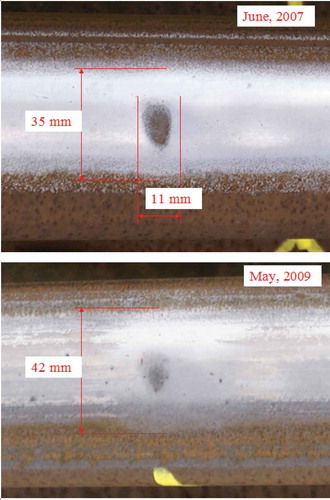
Figure 19. The shape and dimension of the generalized defects. (a) Profiles at the deepest longitudinal–vertical cross-section and (b) profiles at the deepest lateral–vertical cross-section.
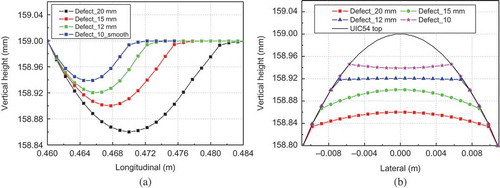
Table 4. The maximal surface v-M stress (MPa).