Figures & data
Figure 1. Field test: (a) Measuring points arrangement; (b) Accelerometer on axle box above wheelset; (c) Accelerometers on carbody floor; (d) DAQ equipment.
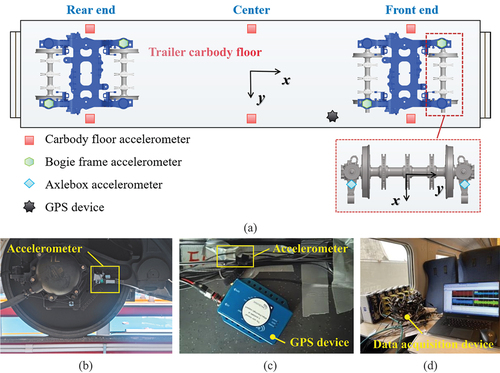
Figure 2. Statistics of CSPs location.
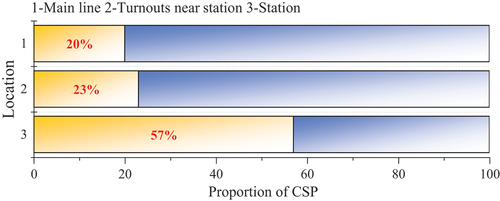
Figure 3. (a) Sperling index of front, middle and rear position of floor; (b) CWT of vertical acceleration in middle floor.
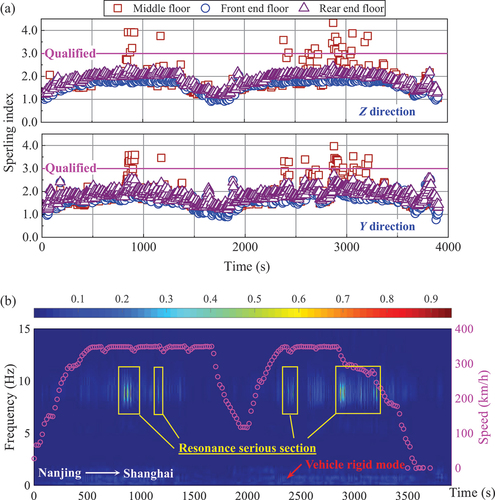
Figure 4. Test results for the vehicle: (a) Vertical acceleration of middle floor; (b) Partial enlargement of Figure (a); (c) Lateral acceleration of bogie frame; (d) Partial enlargement of Figure (c); (e) PSD comparison of middle floor, frame and axle box; (f) Identified carbody DM in modal testing.
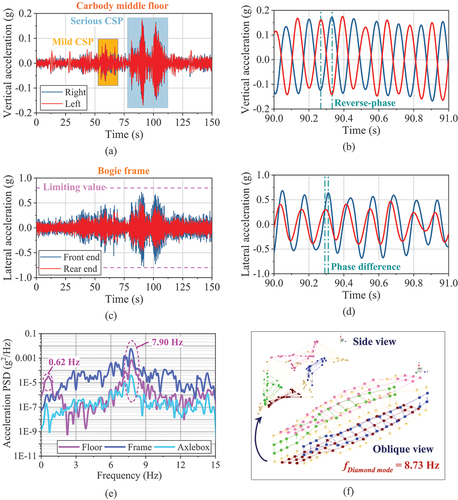
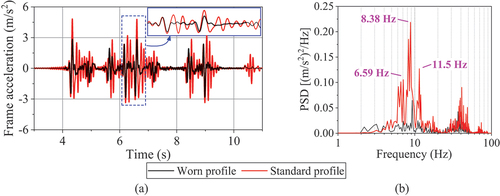
Figure 5. Bogie frame acceleration in turnout section: (a) Time domain; (b) Partial enlargement.
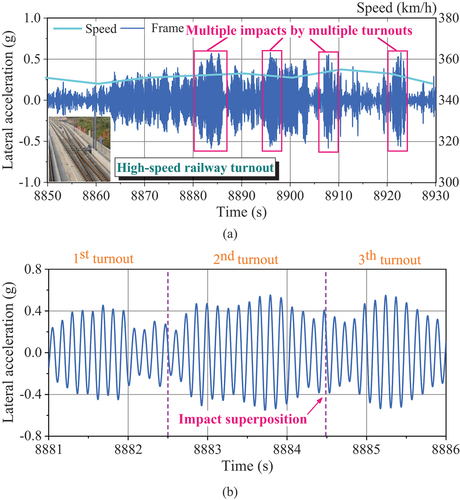
Figure 6. Carbody FE model under service environment: (a) Overall view; (b) Bolster and secondary suspension; (c) Equipment hanging connection.
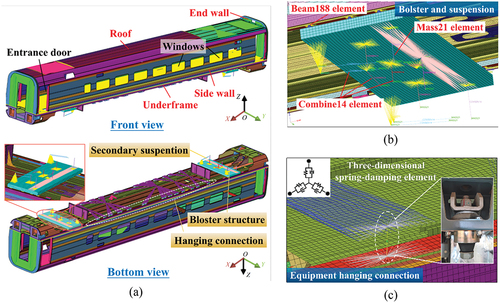
Figure 7. FE model updating flow chart.
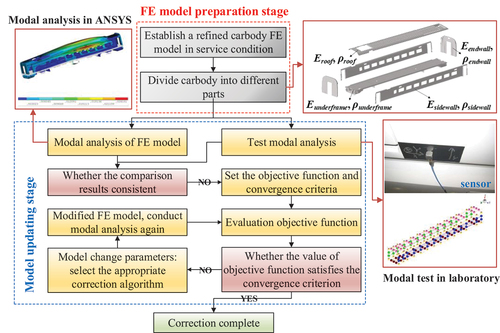
Table 1. Comparison of experimental and simulated modal results.
Figure 8. (a) Schematic view of vehicle-track coupled dynamics model; (b) Floating reference frame for carbody; (c) Schematic diagram of co-simulation of vehicle system and track system.
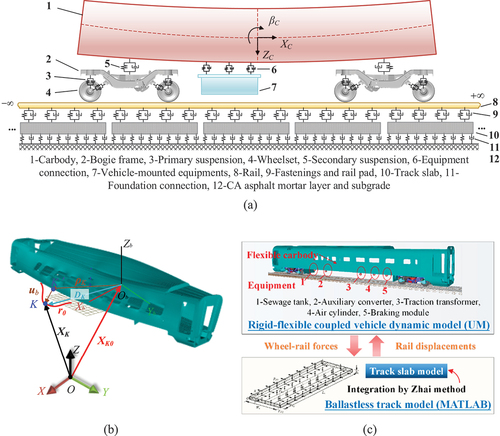
Table 2. Degrees of freedom of vehicle system.
Figure 9. Schematic diagram of turnout near high-speed railway station.
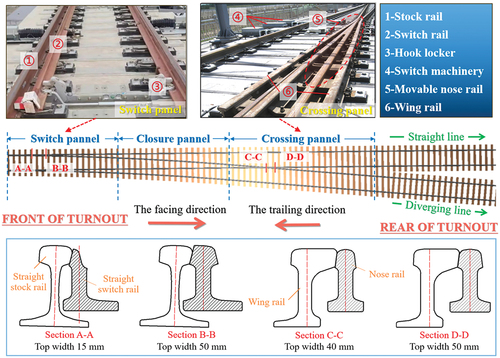
Figure 10. (a) Key sections of switch rail; (b) Schematic diagram of key sections fitting method.
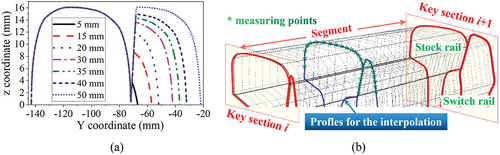
Figure 11. Measured wheel and rail profiles: (a) Wheel profiles; (b) Rail profiles
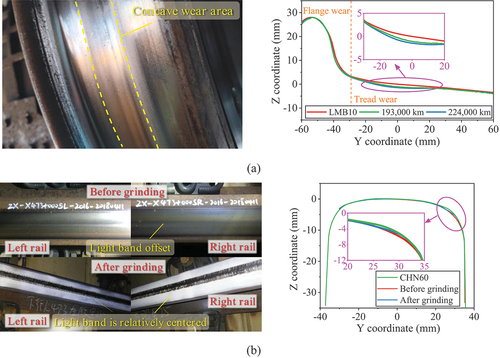
Figure 12. Wheel-rail contact pairs: (a) SWP-CHN60; (b) SWP-BGRP; (c) SWP-AGRP; (d) WWP-CHN60; (e) WWP-BGRP; (f) WWP-AGRP.
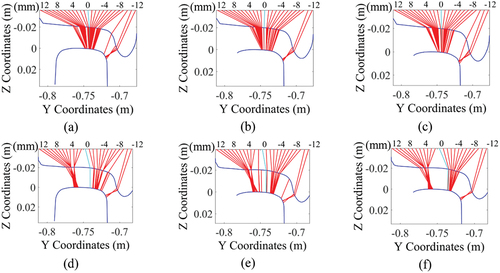
Figure 13. Geometric analysis of wheel-rail contact: (a) Equivalent conicity of SWP; (b) Equivalent conicity of WWP; (c) Rail coordinate position of SWP; (d) Rail coordinate position of WWP.
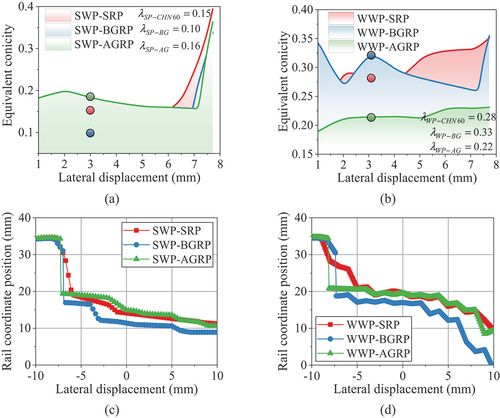
Table 3. Cause classification of hunting motion frequency of bogie.
Figure 14. Simulation results of wheel-rail force: (a) Time domain; (b) PSD of wheel-rail vertical force; (c) PSD of wheel-rail lateral force.
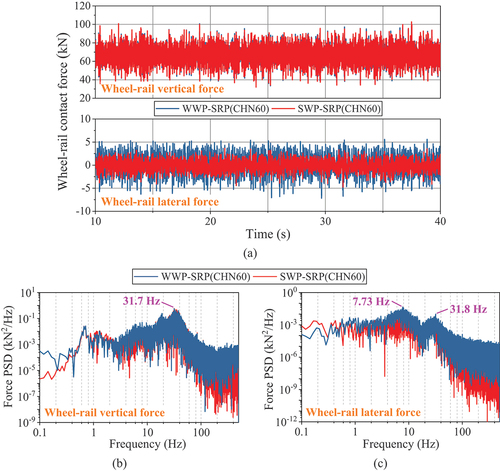
Figure 15. Simulation results of middle floor: (a) Time domain of vertical acceleration; (b) Time domain of lateral acceleration; (c) CWT of vertical acceleration; (d) CWT of lateral acceleration.
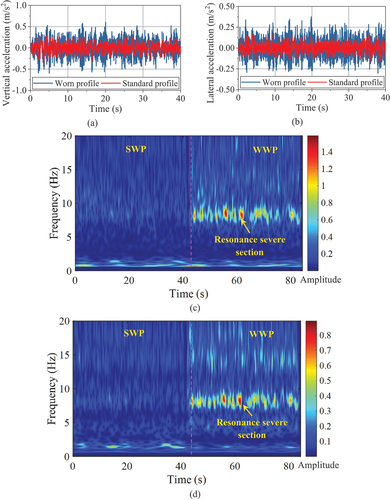
Figure 16. Distribution comparison diagram of carbody middle floor acceleration: (a) Vertical; (b) Lateral.
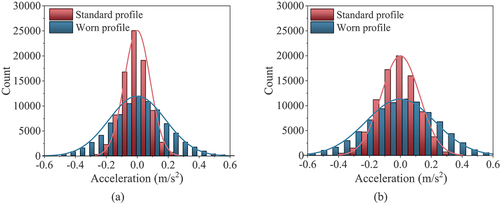
Figure 17. Bogie frame lateral acceleration: (a) Time-domain; (b) PSD.
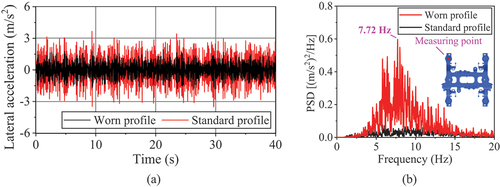
Figure 18. Time-domain of carbody underframe side beam accelerations: (a) Operation modal test; (b) Vertical acceleration; (c) Lateral acceleration; (d) Partial enlargement of Figure (a); (e) Partial enlargement of Figure (c).
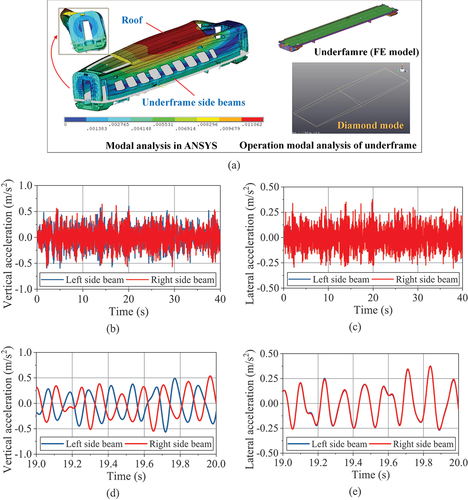
Figure 19. Comparison diagrams of middle floor accelerations before and after rail grinding: (a) Time-domain; (b) PSD.
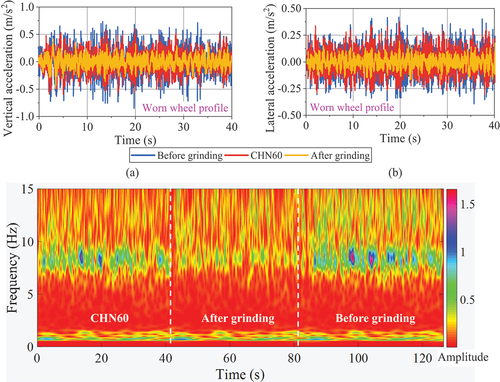
Figure 20. (a) SWP-Switch rail with top width of 35 mm; (b) WWP-Switch rail with top width of 35 mm; (c) Rail coordinate position of WWP-Switch rail.
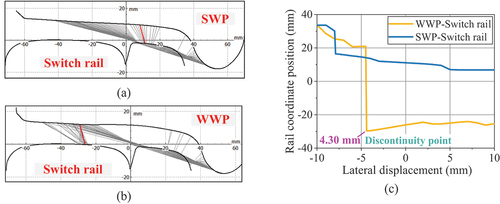
Figure 21. Type of turnout layout and middle floor acceleration: (a) Type A; (b) Type B; (c) Vertical; (d) Lateral.
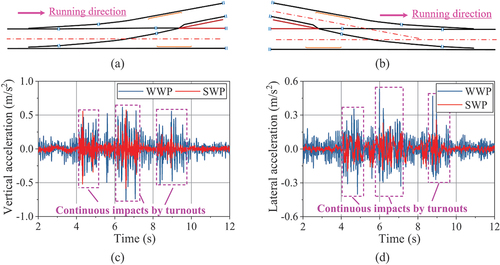
Figure 22. Middle floor acceleration: (a) PSD of vertical acceleration; (b) PSD of lateral acceleration; (c) CWT of vertical acceleration under SWP and WWP condition.
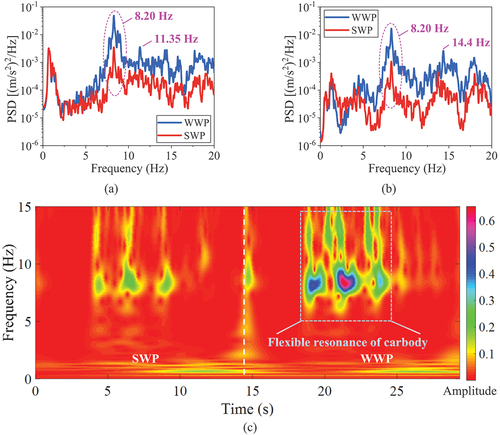
Figure 23. Bogie frame lateral acceleration: (a) Time-domain; (b) PSD.