Figures & data
Figure 1. Kinetic diagram.
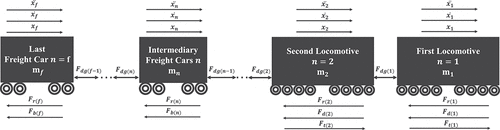
Table 1. Locomotives and freight cars parameter.
Figure 2. Locomotive traction and dynamic brake curves.
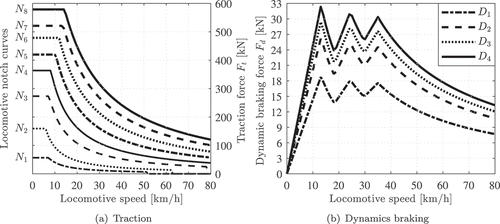
Figure 3. Friction draft gear model: (a) loading stage 1, (b) loading stage 2, (c) unloading stage 1 and (d) unloading stage 2; 1- follower, 2- central wedge, 3- wedge shoe, 4- release spring, 5- outer stationary plate, 6- movable plate 7- lubricating metal, 8- inner stationary plate, 9- spring seat, 10- main springs, and 11- housing.
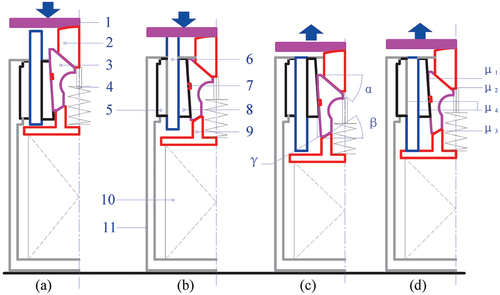
Figure 4. Brake model schematic.
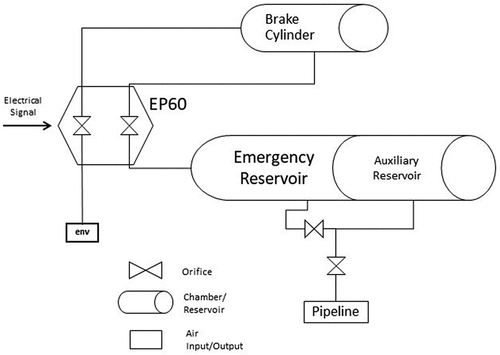
Figure 5. Train traction and braking schedule according to the railroad position.
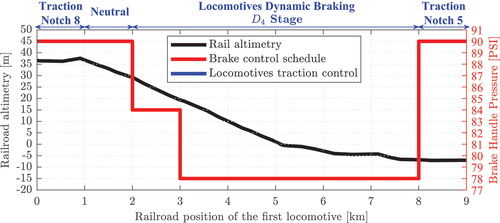
Figure 6. Fuzzy logic optimizable membership functions.
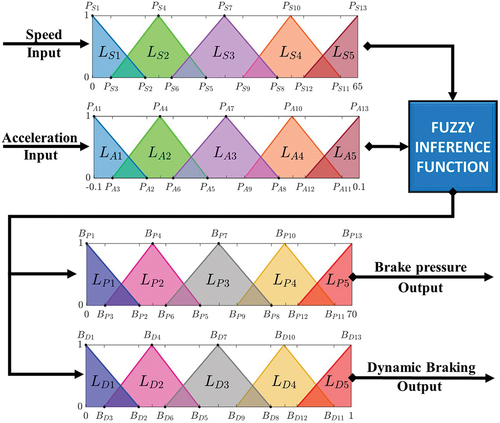
Table 2. Fuzzy control rules.
Figure 7. Optimized solutions.
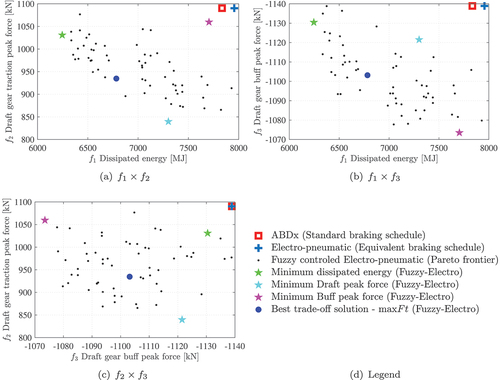
Table 3. Standard and optimized results.
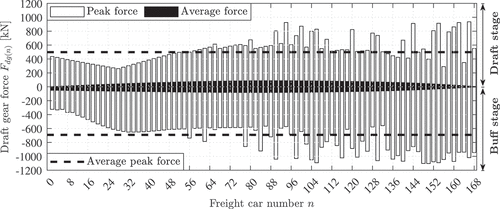
Figure 8. Draft gear peak forces – standard schedule.
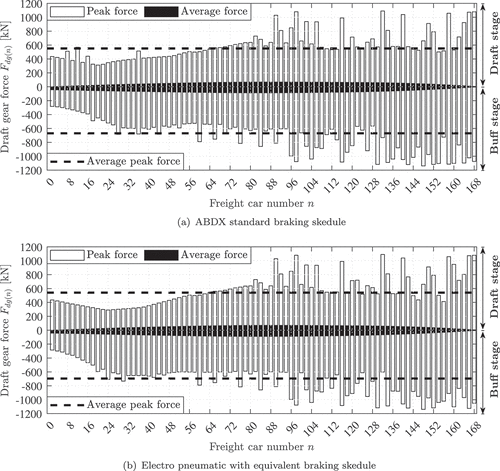
Figure 9. Rolling-stock speed and braking cylinder pressure in the downhill section.
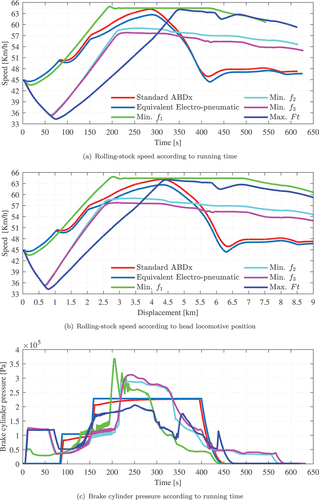
Figure 10. Draft gear peak forces – best of each criterion.
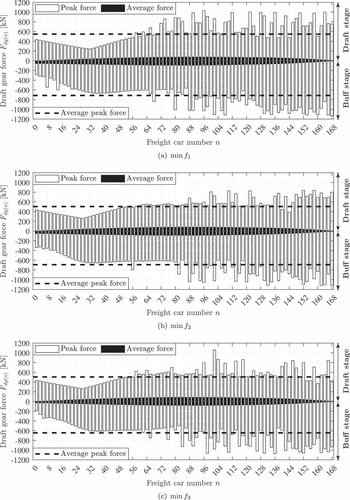
Figure 11. Draft gear peak forces for the best trade-off solution.