Figures & data
Table 1. Example story in Dutch (with English glosses).
Table 2. Questions following the story in in Dutch (with English glosses).
Figure 1. The structure of presentation of the stimuli during one trial. Each trial started by showing a fixation cross for 1500 ms, before the referents appeared on the screen. The story started 1500 ms after presentation of the referents. The story was followed by a 1100 ms pause, followed by the question. After the question, the participant could respond by selecting one of two referents on the screen. The selected referent was highlighted with a black frame for 1000 ms. Finally, the participant was given the opportunity to blink for 3000 ms before the next trial started.
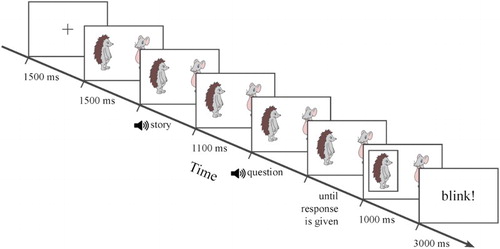
Figure 2. The percentage of target responses for each subject/object combination, per question type. Error bars are derived from logistic analysis. Object questions about stories with a reflexive, indicated with diagonal lines, referred to the second clause of the story and cannot directly be compared to the other questions, which referred to the third clause of the story.
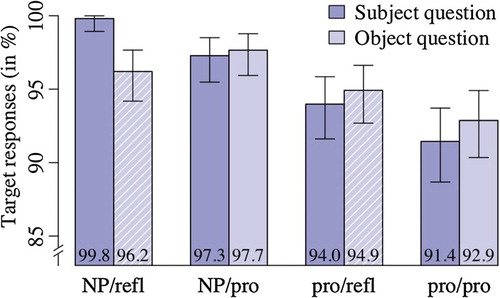
Table 3. An overview of the estimates (β), the z-scores, and the p-values of the fixed factors entered in the generalised linear mixed-effect model for the analysis of the responses.
Figure 3. Illustration of the reported three-way interaction between subject form, object form, and question type in the analysis of the responses. Note that object questions about stories with a reflexive, indicated by the solid line in the right graph, referred to the second clause of the story and therefore care should be taken when comparing the results from these questions to the other questions, which referred to the third (i.e. final) clause of the story. See main text for further discussion.
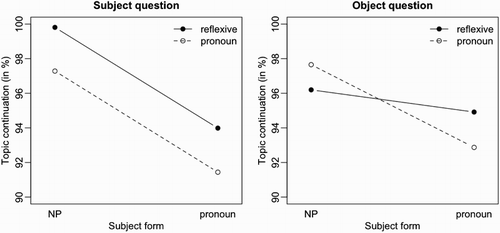
Figure 4. The mean RTs for each subject/object combination, per question type. Error bars are based on a 95% two-sided non-parametric confidence interval estimated through bootstrapping. Object questions about stories with a reflexive, indicated with diagonal lines, referred to the second clause of the story and cannot directly be compared to the other questions, which referred to the third (i.e. final) clause of the story.
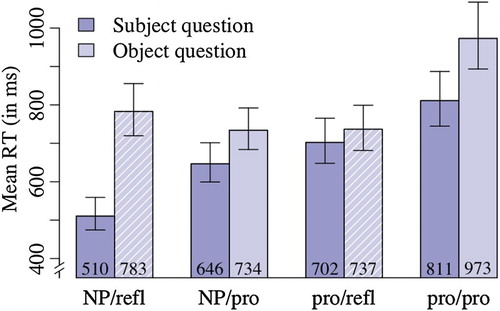
Table 4. An overview of the estimates (β), the t- and p-values of the fixed factors entered in the linear mixed-effect model for the analysis of the RTs.
Figure 5. Illustration of the reported three-way interaction between subject form, object form, and question type in the analysis of the mean RTs. Note that object questions about stories with a reflexive, indicated by the solid line in the right graph, referred to the second clause of the story and therefore care should be taken when comparing the results from these questions to the other questions, which referred to the third (i.e. final) clause of the story. See main text for further discussion.
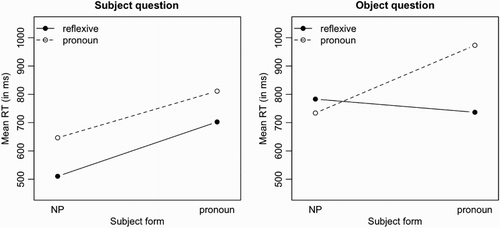
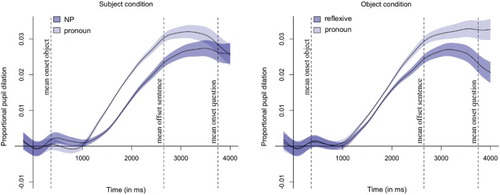
Figure 6. The proportional pupil dilation over time, plotted for each subject/object combination. The time is aligned to the onset of the subject. Vertical dotted lines indicate the means of the onset of the object (50–750 ms after the onset of the subject), the offset of the test sentence, and the onset of the question.
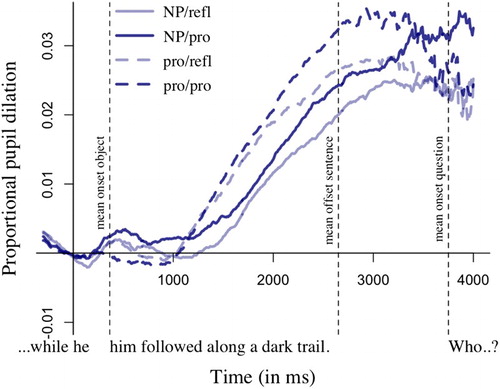
Figure 7. The left graph shows the model fits for a subject NP and a subject pronoun. The right graph shows the model fits for a reflexive object and a pronominal object. Time indicates the time relative to the onset of the subject of the third clause. Vertical dotted lines indicate the means of the onset of the object (50–750 ms after the onset of the subject), the offset of the test sentence, and the onset of the question.