Figures & data
Figure 1. The semantic blocking effect in reaction times. Data from the first cycle were excluded (following Belke et al., Citation2005).
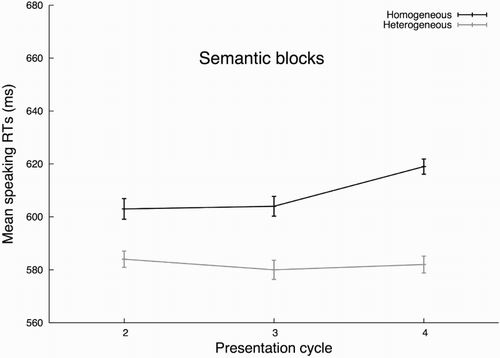
Figure 2. The grand average ERPs of the semantically homogeneous (S+) and heterogeneous (S-) conditions. The top graph (a) depicts the ERPs from a representative anterior electrode FC4, with more negativities in the S- than S+ condition. The middle graph (b) depicts the ERPs from a representative posterior electrode Pz, with more positivities in the S- than the S+ condition. The bar graph (c) summarises the p-values resulting from the pairwise t-tests on the mean amplitudes within each time window per ROI in the semantic blocks. The red line refers to the significance level .05. Four ROIs are represented: left-anterior (blue), right-anterior (green), left-posterior (yellow) and right-posterior (orange).
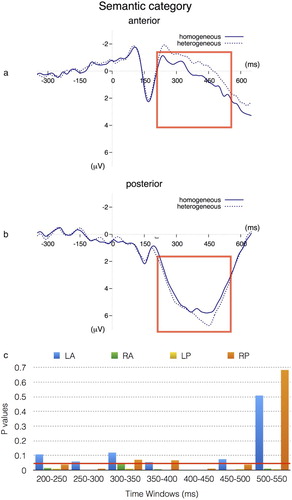
Figure 3. The phonological facilitation effect in reaction times across presentation cycles.
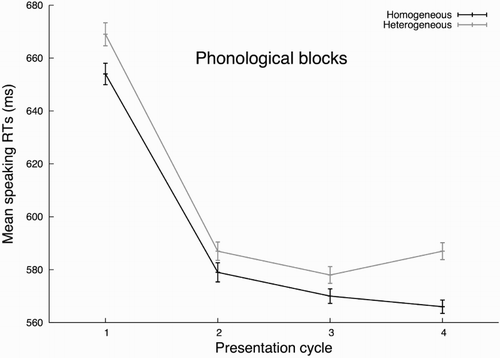
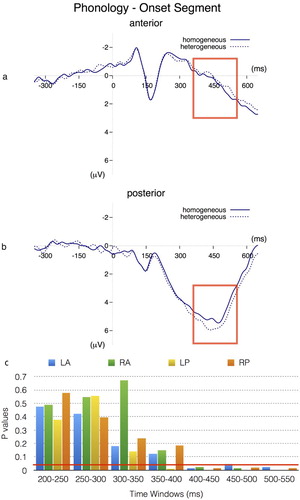
Figure 4. The grand average ERPs of the phonologically homogeneous (P+) and heterogeneous (P-) conditions. The top graph (a) depicts the ERPs from a representative anterior electrode FC4, with more negativities in the P- than P+ condition. The middle graph (b) depicts the ERPs from a representative posterior electrode Pz, with more positivities in the P- than the P+ condition. The bar graph (c) summarises the p-values resulting from the pairwise t-tests on the mean amplitudes within each time window per ROI in the phonological blocks. The red line refers to the significance level .05. Four ROIs are represented: left- anterior (blue), right-anterior (green), left-posterior (yellow) and right-posterior (orange).