Figures & data
Figure 1. A schematic figure for temporal dynamics of information flow during natural speech perception. In the present study, we analysed transfer entropy (TE) to investigate two mechanisms of information flow during natural speech perception: (1) Predictive speech coding (top-down prediction mechanism investigated by negative delays between speech-brain; purple colour) and (2) Speech entrainment (stimulus-driven bottom-up processing investigated by positive delays between speech-brain; cyan colour). For speech signal, we used low-frequency delta phase information, and for brain signal, we used both low-frequency delta phase and high-frequency beta power information. Note that the signal waveform for the MEG signal shown in this figure and following figures is schematic illustration.
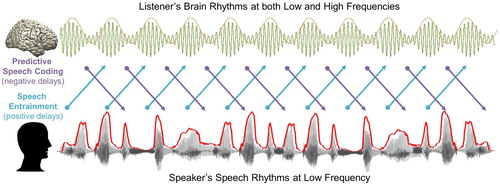
Figure 2. Entrained brain signals following speech. (a) A schematic figure for directed causal analysis: TE from speech delta phase to brain delta phase (positive delays between speech-brain). TE computation was performed for each condition (forward played and backward played) at each voxel from 20 to 500 ms with a 20-ms step. Orange line represents delta rhythm in the brain and each circle represents a certain point in time. TE values are averaged within each ROI from the AAL atlas and compared statistically between conditions. T-values are shown in each ROI bilaterally (pink: left hemisphere, green: right hemisphere): (b) primary auditory cortex (Heschl gyrus) (c) Inferior frontal gyrus – opercular part (BA44) (d) precentral gyrus. Statistical significance was shown with two red lines depicting t-values by paired t-test (upper red line: t21 = 3.53, p < 0.05, corrected; bottom red line: t21 = 2.08, p < 0.05, uncorrected).
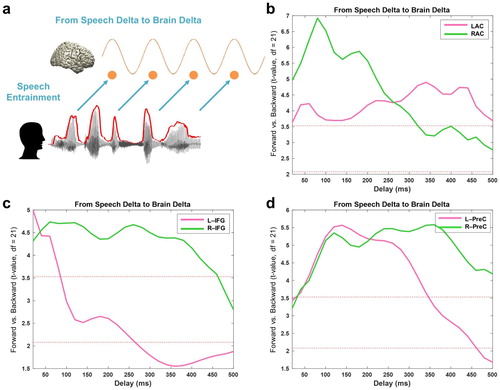
Figure 3. Entrained brain signals predicting upcoming speech. (a) A schematic figure for directed causal analysis: TE from brain delta phase to speech delta phase (negative delays between speech-brain). TE computation was performed for each condition (forward played and backward played) at each voxel from 20 to 500 ms in 20-ms steps and compared statistically between conditions. Orange line represents delta rhythm in the brain and each circle represents a certain point in time. (b) The strongest prediction was found at ∼220 ms in left IFG (upper red line: t21 = 3.53, p < 0.05, corrected; bottom red line: t21 = 2.08, p < 0.05, uncorrected). (c) Statistical contrast maps of averaged across 100 ms windows show a sequence of events that start around −300 ms in fronto-motor areas and then move to right auditory-temporal areas at around −200 ms prior to speech (p < 0.05, FDR-corrected).
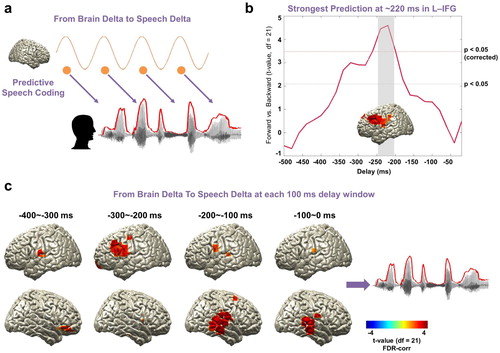
Figure 4. Beta rhythms and the prediction of upcoming speech. (a) A schematic figure for directed causal analysis: TE from brain beta power to speech delta phase (negative delays between speech-brain). TE computation was performed for each condition (forward played and backward played) at each voxel from 20 to 500 ms in 20 ms steps and compared statistically between conditions. Green line represents beta rhythm in the brain and each circle represents a certain point in time. (b) TE values are averaged within each ROI from the AAL atlas and compared statistically between conditions. T-values are shown in each ROI: left primary auditory cortex (Heschl gyrus) (blue line), left IFG (orange line), and left precentral gyrus (both at local maximum coordinate (yellow line) and whole precentral gyrus ROI (light green line)). Statistical significance was shown with two red lines depicting t-values by paired t-test (upper red line: t21 = 3.53, p < 0.05, corrected; bottom red line: t21 = 2.08, p < 0.05, uncorrected). Left-lateralised predictions by beta power were observed (see Supplementary ). (c) Statistical contrast maps of averaged across 100 ms windows show that intelligibility-dependent prediction first engages left inferior frontal gyrus about 300–500 ms prior to the speech followed by left precentral gyrus and left primary auditory area 200–300 ms prior to the speech (p < 0.05, FDR-corrected).
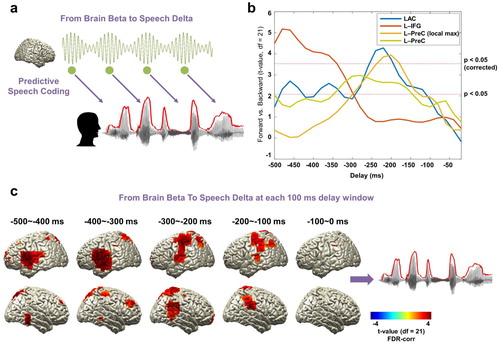
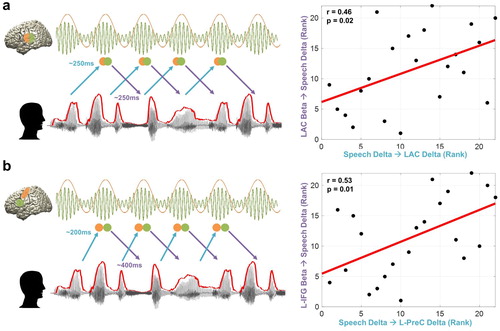
Figure 5. Relationship between temporal dynamics of speech entrainment and predictive speech coding. To assess how the temporal dynamics of speech entrainment (positive delays) and intelligibility-dependent top-down prediction (negative delays) are interacting, we performed correlation analysis using robust Spearman rank correlations across participants between the two mechanisms (but for top-down prediction, we used TE from brain beta to speech delta; ). Orange and green colours represent delta and beta rhythms in the brain and each circle represents a certain point in time. We tested the relationship within in early sensory area. i.e. primary auditory cortex as well as higher order areas. (a) Delta phase in the left auditory cortex driven by speech (corresponding to the plot for the left auditory cortex (pink line) at ∼250 ms in the b) is associated with predictive speech coding mechanism of beta power in the left auditory cortex ∼250 ms prior to the forthcoming speech with low frequency delta phase information (corresponding to the plot for the left auditory cortex (blue line) at ∼250 ms in the b) (r = 0.46, p = 0.02). (b) Delta phase in the left precentral gyrus modulated by the same frequency phase in the speech at ∼200 ms (corresponding to the plot for the left precentral gyrus (pink line) at ∼200 ms in the d) is associated with predictive speech coding of beta power in the left inferior frontal gyrus ∼400 ms prior to the forthcoming speech with low frequency delta phase information (corresponding to the plot for left inferior frontal gyrus (orange line) at ∼400 ms in the b) (r = 0.53, p = 0.01).