
Figures & data
Table 1. Mean scores and standard deviations (between parentheses) on participant descriptives in the two conditions.
Figure 1. Mean scores across the four testing moments (EF = Exposure frequency). Error bars represent 95% confidence intervals based on a bootstrap.
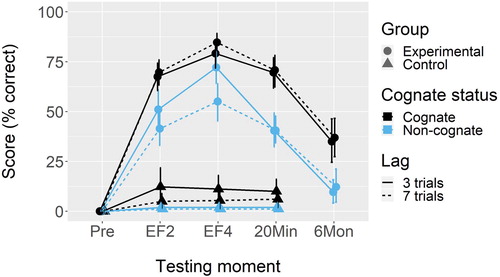
Table 2. Percentage of correctly produced phonemes per target word during the price comparison task (i.e. the learning phase).
Table 3. Percentage of correctly produced phonemes per target word in the two post-tests (i.e. the retention phase).
Table 4. Outcomes of the learning model.
Table 5. Outcomes of the retention model.
Supplemental material
PLCP_A_1599127_Supplemental Material
Download Zip (357.5 KB)Data availability statement
The data and analysis script that support the findings of this study are available at https://github.com/johannadevos/NaturalisticL2WordLearning and at http://hdl.handle.net/11633/di.dcc.DSC_2017.00027_498.