Figures & data
Figure 1. An example of a withhold trial (top) and a passive trial (bottom) in Experiment 1. Figure adapted from Piai et al. (Citation2015).
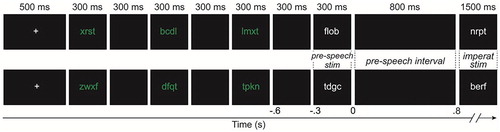
Figure 2. Grand average event-related potentials for the electrode indicated in black. Positivity plotted upwards. The topographical plot is shown for the largest cluster, time-window 0.08–0.24 sec, with electrodes showing a significant effect shown in white.
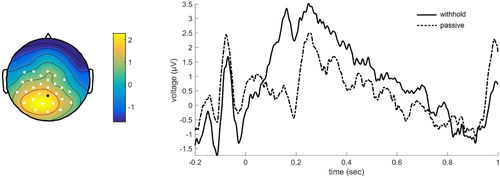
Figure 3. Time-frequency results for the electrode indicated in black. The intensity indicates t-values. Time-frequency points associated with the significant cluster are highlighted. The topographical plot is shown for the time-window 0.20–0.60 sec and frequency range 15–27 Hz.
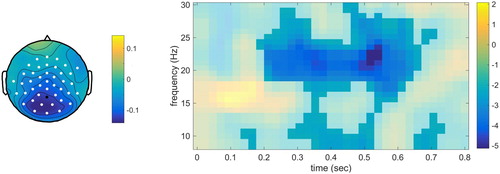
Figure 4. An example of a withhold trial (top), a passive trial (middle), and a no-response trial (bottom) in the visual modality. Experiment 2 only included the withhold and passive condition, Experiment 3 included all three conditions. In the auditory modality, the (pseudo)words were played over speakers and a fixation cross was presented on the screen.
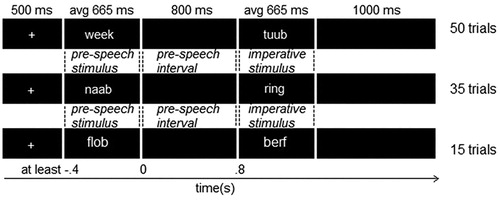
Figure 5. Grand average event-related potentials for the electrode indicated in black. Positivity plotted upwards. The topographical plot is shown separately for the visual modality (time-window −0.29–0.19 sec) and auditory modality (time-window 0.14–0.33 sec), with electrodes showing a significant effect shown in white.
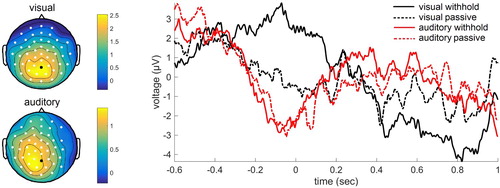
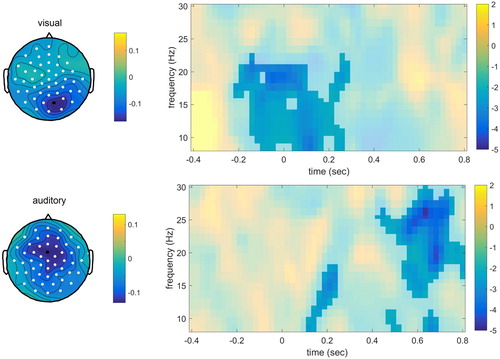
Figure 6. Time-frequency results for the electrode indicated in black, for the visual modality (upper panel) and auditory modality (lower panel) separately. The intensity indicates t-values. The topographical plot for the visual modality is shown for the time-window 0–0.5 sec and frequency range 8–30 Hz, for the auditory modality for 0.60–0.80 sec and 8–22 Hz.
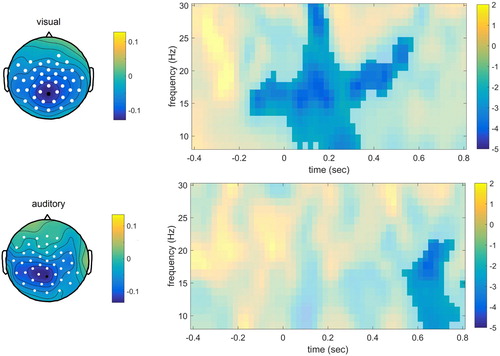
Figure 7. Grand average event-related potentials for the electrode indicated in black. Positivity plotted upwards. The topographical plot is shown separately for the visual modality (time-window −0.16–0.17 sec) and auditory modality (time-window 0.37–0.42 sec), with electrodes showing a significant effect shown in white.
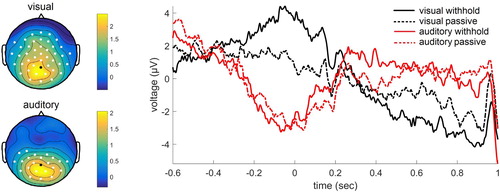
Figure 8. Time-frequency results for the electrode indicated in black, for the visual modality (upper panel) and auditory modality (lower panel) separately. The intensity indicates t-values. The topographical plot for the visual modality is shown for the time-window −0.1–0.2 sec and frequency range 8–22 Hz, for the auditory modality for 0.50–0.70 sec and 17–28 Hz.