Figures & data
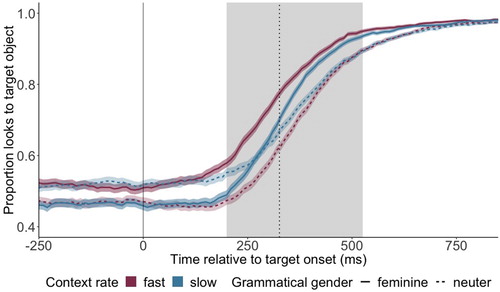
Figure 1. Simplified graphical representation of the cue integration architecture for speech comprehension (adapted from Martin, Citation2016). Cues and their corresponding reliabilities, represented by Gaussian icons, are integrated across different levels of linguistic hierarchy. Predictions about upcoming linguistic information are visualised by black arrows pointing forward. Grey arrows represent sensory resampling, such that cues from different linguistic levels of representations can influence each other.
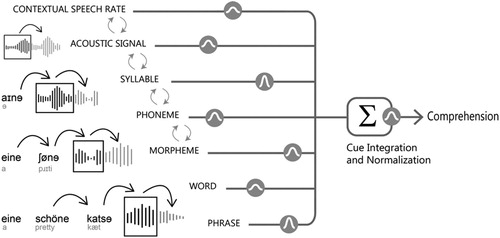
Figure 2. Categorisation curves from the pretest of the proportion of schwa present (i.e. eine) responses as a function of duration continuum step, split for three different contextual speech rates (red: fast rate; green: neutral rate; blue: slow rate). Participants in the pretest only heard short excerpts from the stimulus sentences and indicated whether they heard ein or eine. Longer schwa durations (e.g. step 5) led to more eine responses (i.e. fewer ein responses) and faster speech rate biased listeners to report more eine responses. Error bars represent the standard error of the mean.
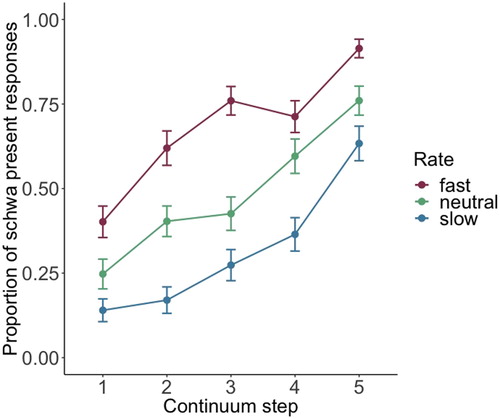
Figure 3. Proportion of looks to feminine object across time in fast (red) and slow contexts (blue). Time point 0 marks the offset of the ambiguous schwa phoneme, indicated by the solid vertical line. The dotted vertical line indicates the mean onset of the disambiguating sound: for feminine target references, this is the onset of the target word itself; for neuter targets, it is the onset of the morpheme -s on the adjective preceding the target word. Shown in grey is the area of interest, spanning from 200 ms after schwa offset until the mean onset of the disambiguating cue. Overall, the proportion of looks to the feminine object was higher in fast as opposed to slow contexts. Shading around the coloured lines represent the standard error of the mean.
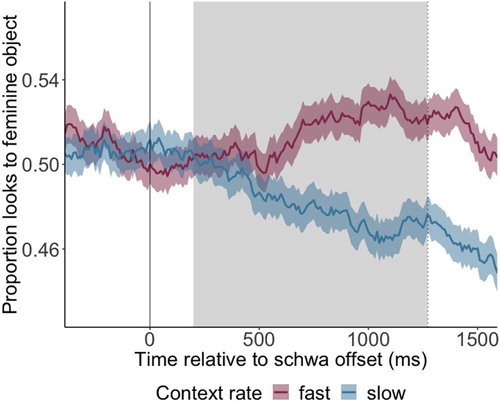
Figure 4. Proportion of looks to target object across time for feminine targets (solid) and neuter targets (dashed) in fast (red) and slow contexts (blue). The feminine-fast (solid red line) and neuter-slow (dashed blue line) conditions represent the Congruent conditions; the feminine-slow and neuter-fast conditions represent the Incongruent conditions. Time point 0 marks the onset of the earliest disambiguating cue (onset of the target word for feminine targets, morpheme -s on the preceding adjective for neuter targets), indicated by the vertical solid line. The vertical dotted line indicates the mean offset of the first target word syllable. Shown in grey is the area of interest, spanning from 200 ms after onset of the disambiguating cue until 200 ms after the mean offset of the initial target word syllable. Shading around the coloured lines represent the standard error of the mean.