
Figures & data
Figure 1. Stimulation protocol. The total duration of the protocol was approximately 1 h. The audio book was presented in 10 subsequent parts with an average duration of 4 min. After each part, three multiple-choice questions on the content of the previous part of the audio book were presented. After audio book parts number 4 and 7, stimulation was interrupted for a short break of approximately 5 min.
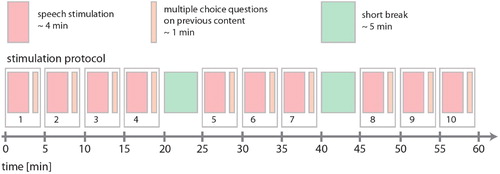
Figure 2. Setup configuration. (a) Wiring scheme of the different devices. (b) The speech sound is transmitted into the magnetically shielded chamber via a custom-made construction consisting of two loudspeakers (1) which are coupled to silicone funnels and (2) each connected to a flexible tube. (c) Through a small whole in the magnetically shielded chamber (1), speech sound is transmitted via the two flexible tubes (2).
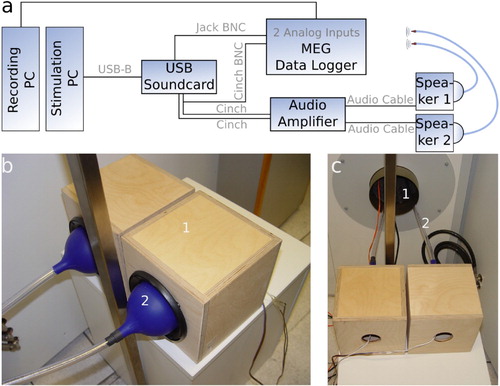
Figure 3. Alignment of speech stream and MEG signal. (a) Sample audio book wave file together with time tags of word boundaries from forced alignment. (b) Corresponding recordings of two analogue auxiliary channels of the MEG. (c) Alignment of data streams from a and b, together with one sample MEG channel.
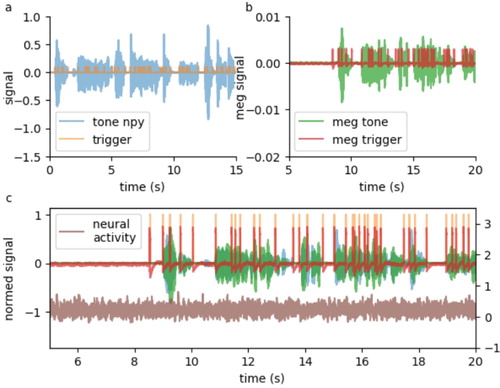
Figure 4. Segmentation of speech stream and MEG signal. After alignment, the continuous wave file (top panel) and multi-channel MEG recordings (bottom panel) are segmented using the time tags from forced alignment as boundaries and labelled with the corresponding types, i.e. words.
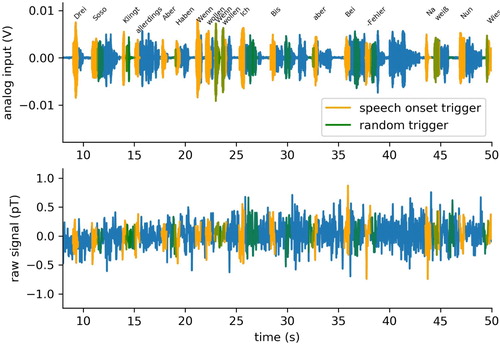
Figure 5. Distributions of word classes and bi-gram word classes. (a,c,e,g,i) Distribution of word classes according to POS tagging. Adjectives (ADJ), adverbs (ADV), nouns (NOUN), proper nouns (PROPN), verbs (VERB), adpositions (ADP), auxiliary verbs (AUX), determiners (DET), particles (PART), pronouns (PRON), subordinating conjunctions (SCONJ). (b,d,f,h,j) Distribution of word classes of 2-word sequences. Rows: word class of first word. Columns: word class of second word.
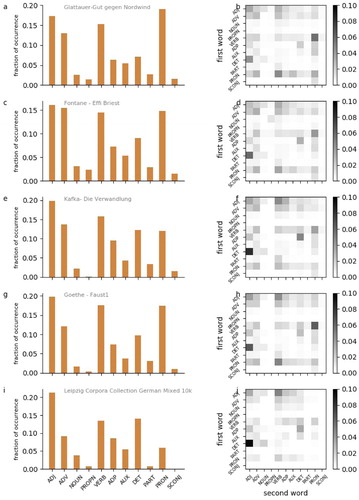
Figure 6. MDS projection of word class distributions. (a) MDS projection of distributions of single word classes. (b) MDS projection of distributions of bi-gram word classes combinations.
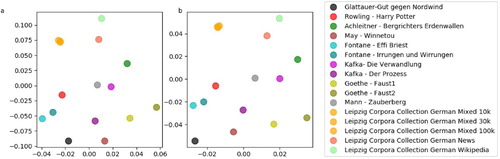
Figure 7. Event–related fields for word onset. Shown are exemplary data of book parts number 1–3 of 10 from subject 2 of 15. (a) Summary of ERFs of all 248 recording channels averaged over 291 trials. (b) Spatial distribution of ERF amplitudes at 350 ms after word onset. (c) The largest amplitudes occur in channels located at temporal and frontal areas of the left hemisphere. (d) The corresponding channels at the right hemisphere show clearly smaller ERF amplitudes. (e) The same is true for occipital channels. (f) Same channels as in c, but averaged over randomly chosen triggers instead of word onset triggers. Also in this control condition, the resulting amplitudes are smaller than those for the word onset condition.
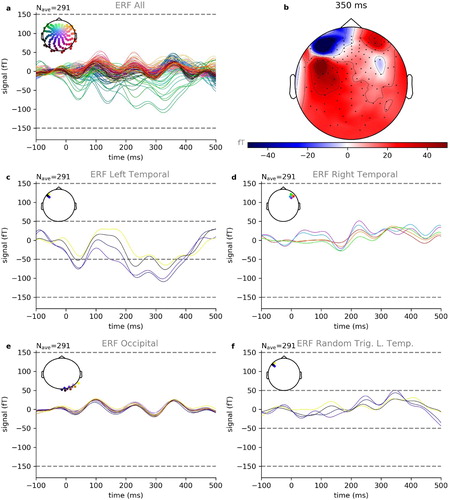
Figure 8. Event-related fields for function and content words. Shown are exemplary data of book parts number 1–3 of 10 from subject 2 of 15. (a) Averaged ERFs for content words (n = 81 trials) with largest amplitudes. (b) Spatial distribution of ERF amplitudes at 550 ms after word onset for content words. (c) Averaged ERFs for function words (n = 106 trials) with largest amplitudes. (d) Spatial distribution of ERF amplitudes at 550 ms after word onset for function words. (e) ERF with the largest amplitude for content words and function words, together with ERFs derived from permutation test. (f) Distribution of ERF amplitudes derived from permutation test within four subsequent time frames: 0–250 ms (upper left), 250–500 ms (upper right), 500–750 ms (lower left) and 750–1000 ms (lower right).
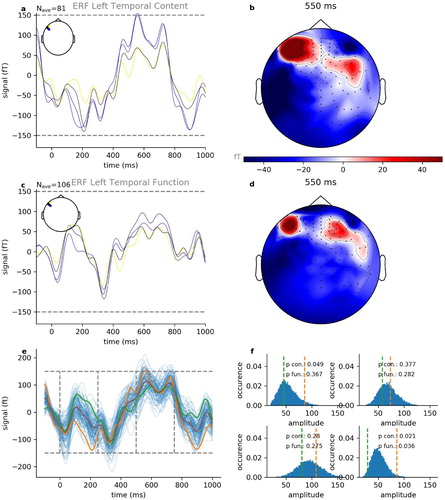
Figure 9. Normalised power spectra for words and silence. Shown are exemplary data of book parts number 1–3 of 10 from subject 2 of 15. (a–c) Power spectra for word offset, i.e. silence. (d–f) Power spectra for word onsets. (a,d) Alpha frequency range. (b,e) Beta frequency range. (c,f) Gamma frequency range.
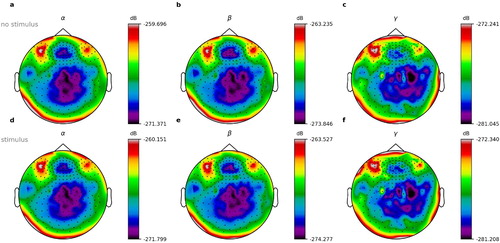
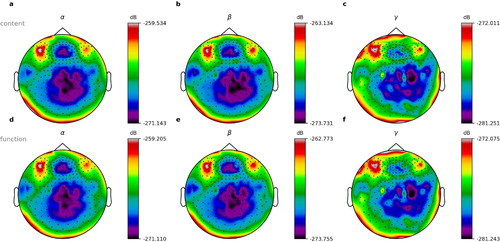
Figure 10. Normalised power spectra for content and function words. Shown are exemplary data of book parts number 1–3 of 10 from subject 2 of 15. (a–c) Power spectra for content words. (d–f) Power spectra for function words. a,d: Alpha frequency range. (b,e) Beta frequency range. (c,f) Gamma frequency range.
Supplementary Material
Download PDF (8.6 MB)Data availability statement
Data will be made available to other researches on reasonable request.