
Figures & data
Table 1. Psycholinguistic properties and semantic ratings are shown for each word sub-category, as well as for the categories of action- and object-related words. Means and standard errors (in brackets) are reported for each word category, along with results of an ANOVA comparing ratings between word groups.
Figure 1. Representational dissimilarity matrices (RDM) displaying the semantic distances among the 96 stimulus words based on (a) the grounded “experiential” model reflecting human ratings (bottom left); (b) the distributional model based on GloVe (bottom right) and (c) the integrative model (top panel). The dissimilarity values from the two matrices were normalised before integration by averaging. Dark blue ( = 0) indicates maximal similarity between identity pairs and yellow ( = 1) indexes maximal dissimilarity. Each square in the model RDM shows (dis)similarities between the individual word items, which are plotted from top to bottom and from left to right – with dark blue indicating great semantic similarity or identity and red/yellow indexing dissimilarity. Therefore, the first diagonal in the matrix indicates the semantic identity of each single item with itself. Note that the integrated model at the top (see for statistical tests) reflects a the categorial semantic structure of the stimulus vocabularies; please note the series of six blue squares form top left to bottom right representing semantic similarities within each of the six semantic subtypes. Also, the lexical categories of verbs and nouns are clearly revealed by this integrated model (big red/yellow “dissimilarity squares” at lower left and upper right). The only exception from the between-lexical category-dissimilarity is seen for tool words, which are indeed semantically associated with action verbs (for example, “knife” and “carve”/ “peel”). The sensorimotor model shows the similarities differences in lexicosemantic categories comparably. The distributional model also reflects the categorical semantic structure of the previous models to a lesser extent.
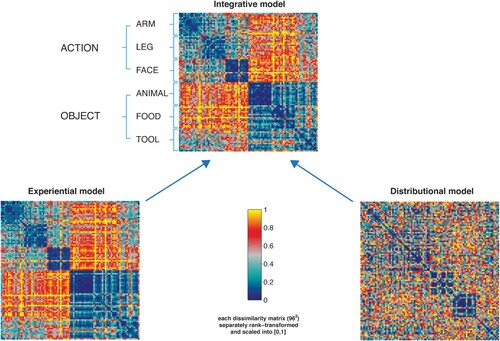
Figure 2. Results from whole-brain searchlight RSA (on the left). Left top panel: widespread activity triggered by the integrative model RDM in distributed prefrontal, premotor, inferior temporal and parieto-occipital cortex. Left middle panel: comparable correlational effects of the experiential model in the pars opercularis of the inferior frontal cortex (BA 44), premotor, inferior temporal and parietal cortex. Left bottom panel: activity triggered by the distributional model RDM in higher-order regions in left inferior frontal cortex (BA 47) and anterior temporal cortex. Results from model comparisons for the whole-brain searchlight RSA (on the right). Right top panel: correlation differences between the brain activity RDMs correlating with integrative model RDM minus the brain activity RDMs correlating with experiential model RDM in left posterior ITG and MTG. Right bottom panel: correlation differences between brain activity RDMs correlating with the integrative model RDM minus the brain activity RDMs correlating with distributional model RDM were seen in dorsal pre-supplementary motor area, and right AG.
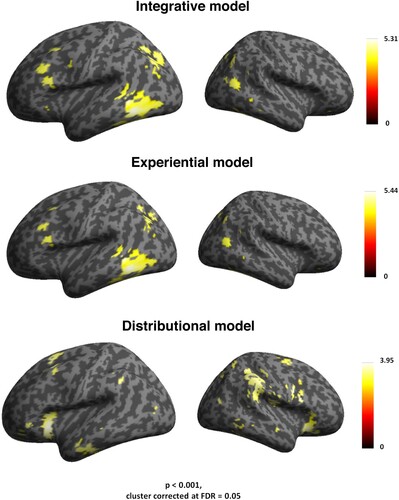
Table 2. Results from searchlight RSA for the integrative model. Table of coordinates and significance voxel-level peak values (p) in each activation cluster that was correlated with the integrated semantic model integrating distributional and sensorimotor information.
Table 3. Results from searchlight RSA for the experiential. Table of coordinates and significance voxel-level peak values (p) in each activation cluster that was correlated with the sensorimotor semantic model.
Table 4. Results from searchlight RSA for the distributional model. Table of coordinates and significance voxel-level peak values (p) in each activation cluster that was correlated with the distributional semantic model.
Table 5. RSA results from model comparisons in the searchlight framework. Table of coordinates and significance voxel-level peak values (p) in each activation cluster that was correlated with the integrative model contrasted against the distributional semantic model.
Table 6. RSA results from model comparisons in the searchlight framework. Table of coordinates and significance voxel-level peak values (p) in each activation cluster that was correlated with the integrative model contrasted against the experiential model.
Figure 3. RSA results in the selected ROIs projected onto a flat map of the left hemisphere (the left panel). On the right: The bar graph depicts the averaged model-fMRI pattern correlations for each of the ROI under examination (the corresponding bar is indicated with the same colour as the ROI) across subjects (23). Spearman's rank correlations were calculated to assess the relatedness between brain activity and model RDMs and statistical inference was applied on the single subject correlations using a one-sided signed-rank test across subjects, testing whether the resulting correlation coefficients were significantly greater than zero. Below each bar, the significance value for the test is reported, corrected for multiple testing across brain regions by applying the FDR procedure (marked with an asterisk); the expected FDR was less than 5% (Benjamini & Hochberg, Citation1995). The horizontal bars in black indicate significant differences from model comparisons after FDR correction across ROIs (FDR = 0.05). Left panel: Effects specific to the LIFG (BA 44), where the distributional model differed significantly from both the sensorimotor and integrative models. Left panel: Effects specific to the left pITG. There was a significant difference (FDR = 0.05) between the effects of the sensorimotor and integrative models and the ones triggered by the distributional model.
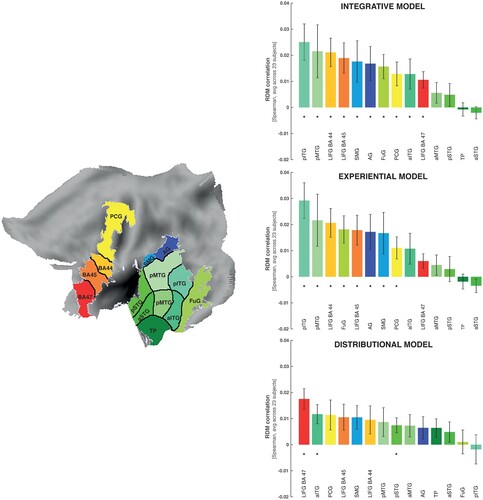
Table 7. RSA results from ROI analyses testing for relatedness between models and brain activity patterns for all words. Table of correlation values (r) and significance values (P) between the brain activity patterns in ROIs and the three models for all words per ROI. Correlations values which survive FDR correction for multiple comparisons and the model are indicated by asterisk (*).
Figure 4. RSA results from model comparisons across all words for selected ROIs and for each of the three models: distributional (green), experiential (dark blue), and integrative model (light blue) (lines above bars indicating significance, p < 0.05 FDR corrected). Left panel: Semantic similarity effects specific to the left pITG, where the sensorimotor and integrative models matched the brain activity patterns significantly better than the distributional model. Right panel: Semantic similarity effects specific to the LIFG (BA 47), where the distributional model fits the brain activity patterns significantly better than the sensorimotor and the integrative models. The diagrams are based on the Spearman's rank correlations calculated to assess the relatedness between brain activity and model RDMs.
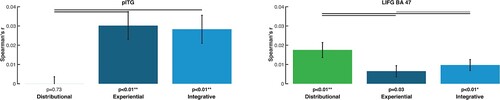
Table 8. RSA results from ROI analyses testing for relatedness between models and brain activity patterns for action words. Table of correlation values (r) and significance values (P) between the brain activity patterns in ROIs and the three models for object words per ROI. Correlations values which survive FDR correction for multiple comparisons and the model are indicated by asterisk (*).
Figure 5. Category-specific results for object- and action-related concepts from model comparisons. The bar graphs depict the averaged correlations between the brain activity RDMs in selected ROIs and the (48 × 48) RDMs for the distributional (green), the experiential (dark blue), and the integrative (light blue) models for the sub-spaces of action and object words. Significant differences are indicated by the horizontal bars in black after FDR correction across models (FDR = 0.05). (A) For action words, there was no significant difference in model performance, as the three models performed equally for LIFG (BA 44-45-47); similar results were seen in pITG and pMTG. (B) For object words, the integrative and experiential models were significantly superior to the distributional model in the pMTG, FuG, and AG.
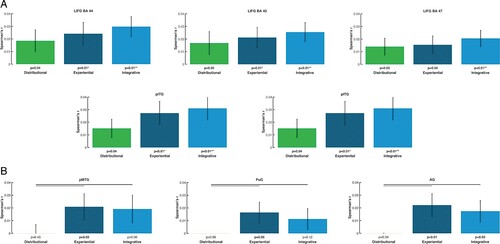
Table 9. RSA results from ROI analyses testing for relatedness between models and brain activity patterns for object words. Table of correlation values (r) and significance values (P) between the brain activity patterns in ROIs and the three models for object words per ROI. Correlations values which survive FDR correction for multiple comparisons and the model are indicated by asterisk (*).
Figure 6. (A) Category-specific results for object- and action-related concepts from model comparisons. The bar graphs depict the averaged correlations between the 48 × 48 brain activity RDMs in specific cortical areas and the model RDMs based on action-related semantic properties (top panels) and visual properties (bottom panel) for the sub-spaces of action (orange) and object (green) words. Significant differences are indicated by the horizontal bars in black after FDR correction across models (FDR = 0.05). Top panel: in LIFG (BA 44), PCG and SMG, the model based on action-related semantic properties was correlated more strongly with the similarity patterns specific to action words as compared to the ones specific to object words. Bottom panel: in the FuG and AG, the opposite was found, i.e. greater correlations between the similarity structure based on the visual properties and the similarity structure of the brain activity patterns for object words than for action words. (B) Results from statistical analyses showing differential mapping of lexicosemantic categories obtained (ANOVA design: Word Category (action verbs vs. object nouns)×Region (frontal vs. temporo-occipital regions of interest)), with a significant cross-over interaction between the factors Region and Word Category (F [1, 22] = 7.45, p = 0.01). This effect obtained by employing the integrated semantic vector model revealed a double dissociation in the semantic similarity mappings of action and object words onto focal category-preferential (BA 44, PCG) and category general (SMA, AG, FUG) regions. A comparable interaction effect was also found when the experiential model alone was applied (F [1, 22] = 7.85, p = 0.012). The distributional model did not reveal any semantic mapping differences across word categories.
![Figure 6. (A) Category-specific results for object- and action-related concepts from model comparisons. The bar graphs depict the averaged correlations between the 48 × 48 brain activity RDMs in specific cortical areas and the model RDMs based on action-related semantic properties (top panels) and visual properties (bottom panel) for the sub-spaces of action (orange) and object (green) words. Significant differences are indicated by the horizontal bars in black after FDR correction across models (FDR = 0.05). Top panel: in LIFG (BA 44), PCG and SMG, the model based on action-related semantic properties was correlated more strongly with the similarity patterns specific to action words as compared to the ones specific to object words. Bottom panel: in the FuG and AG, the opposite was found, i.e. greater correlations between the similarity structure based on the visual properties and the similarity structure of the brain activity patterns for object words than for action words. (B) Results from statistical analyses showing differential mapping of lexicosemantic categories obtained (ANOVA design: Word Category (action verbs vs. object nouns)×Region (frontal vs. temporo-occipital regions of interest)), with a significant cross-over interaction between the factors Region and Word Category (F [1, 22] = 7.45, p = 0.01). This effect obtained by employing the integrated semantic vector model revealed a double dissociation in the semantic similarity mappings of action and object words onto focal category-preferential (BA 44, PCG) and category general (SMA, AG, FUG) regions. A comparable interaction effect was also found when the experiential model alone was applied (F [1, 22] = 7.85, p = 0.012). The distributional model did not reveal any semantic mapping differences across word categories.](/cms/asset/37ddf921-3f5c-4dbd-8e39-51fc2c8aea31/plcp_a_2232481_f0006_oc.jpg)