
Figures & data
Figure 1. Intercorrelation matrix of relevant semantic, psycholinguistic, and context variables. All correlations greater than |.2| are reported numerically in the matrix.
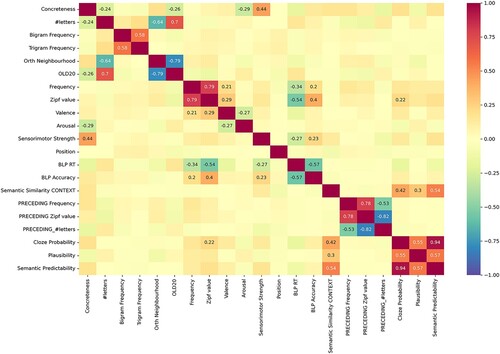
Table 1. Examples of the stimuli, including the associated concreteness (range 1, highly abstract, to 5, highly concrete) and predictability (range 0, highly unpredictable, to 1, highly predictable).
Table 2. Summary statistics of psycholinguistics and semantic variables. In bold are highlighted the variables included in our analyses.
Table 3. Summary of the measures, averaged across participants.
Table 4. Results of the LME for the first fixation duration analysis.
Table 5. Results of the LME for the gaze duration analysis.
Table 6. Results for the probability of fixation logistic regression analysis.
Figure 2. (A) Visual representation of the estimates in the model. (B) Comparison between conditional effects of concreteness and frequency in the full FFD model, when keeping the other predictors constant.
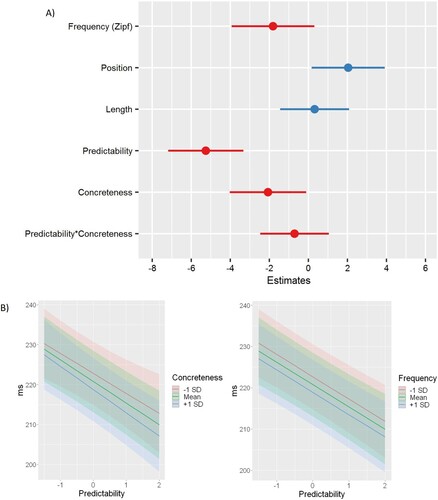
Table 7. LME model including all predictors that significantly influenced FFD.