Figures & data
Table 1. Sketches of the nine ELAS situations.
Table 2. Fit indices of competing factor models, see Appendix C for a description of the models (study 1, N = 1206).
Table 3. Internal consistency (Cronbach’sα) and descriptive statistics of situation scales of the ELAS (study 1, N = 1206).
Table 4. Intercorrelations (Pearson correlations) between the situation scales of the ELAS (study 1, N = 1206).
Table 5. Pearson correlations between situation scales of the ELAS and measures for Memory Efficacy (MSEQ), Executive Functioning (BDEFS) in everyday life, and self-reported ADHD Symptoms (ARS) (study 1, N = 1206).
Table 6. Comparison of situation scale scores (M ± SD) of the ELAS between healthy individuals (Control), a mixed clinical group (Clinical), and patients with ADHD (ADHD) (Study 2, N = 215).
Table 7. Effect sizes (Cohen’s d) of pairwise group comparisons on situation scale scores of the ELAS between a healthy control group (Control), a mixed patient group (Mixed), and an ADHD patient group (ADHD) (Study 2, N = 215).
Figure 1. Graphical impression of the effect sizes (Cohen’s d) of the group differences on situation scale scores of the everyday life attention scale (ELAS). Larger values stand for lower everyday attention scores compared to healthy controls (Study 2, N = 215).
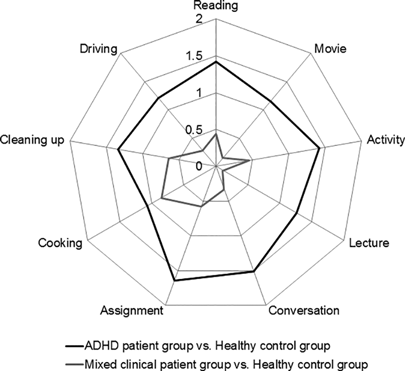
Figure 2. Frequency distribution (in percentages) of patients with ADHD, mixed clinical patients and healthy controls across the number of low attention situations they reported (Study 2, N = 215).
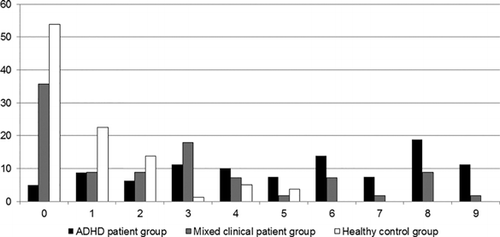
Table 8. Pearson correlations between ELAS situation scores and self-reported ADHD symptom severity among patients with ADHD (Study 2, n = 80).