
Figures & data
Figure 1. Map of state and regional domestic fisheries landings data (closed circles), retail sale data (open circles), or both (half-filled circles). Regions defined by NOAA Fisheries. See for more information on data sources.
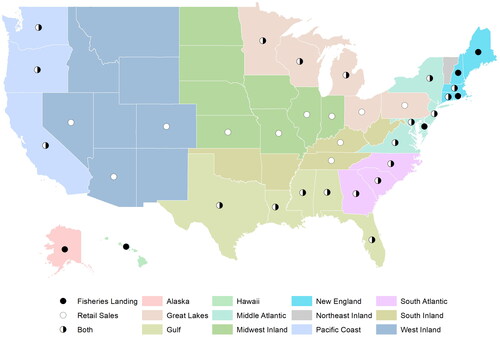
Table 1. Description of study datasets.
Table 2. Commercial landings by month versus year, average 2017–2019 (1,000 metric tonnes).
Figure 2. Monthly United States retail seafood sales A) volume, B) revenue, and C) unit price for three product categories (fresh, frozen, shelf-stable), average 2017-2019. The y-axis is normalized by dividing the monthly values by the maximum monthly value.
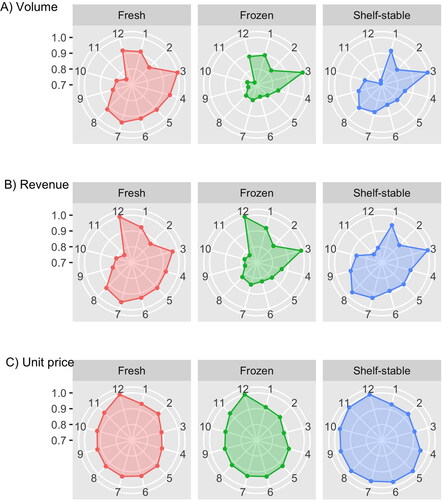
Figure 3. Monthly U.S. retail sales of A) seafood and B) fresh meat (2017-2019). Red = 2017, green = 2018, blue = 2019. Lent is observed during the 40-day period before Easter and varies based on a Lunar calendar. The Lent period was March 1 to April 13 in 2017, February 14 to March 29 in 2018, and March 6 to April 18 in 2019.
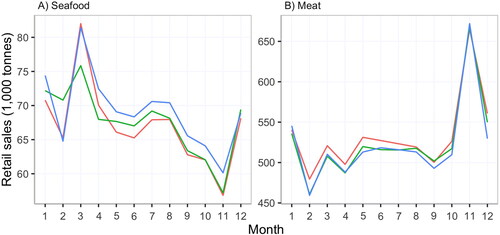
Figure 4. Monthly seafood imports to the United States by A) volume and B) revenue for three product categories (fresh, frozen, preserved), average 2017-2019. The y-axis is normalized by dividing the monthly values by the maximum monthly value. Unit price not plotted. Preserved includes prepared and preserved products.
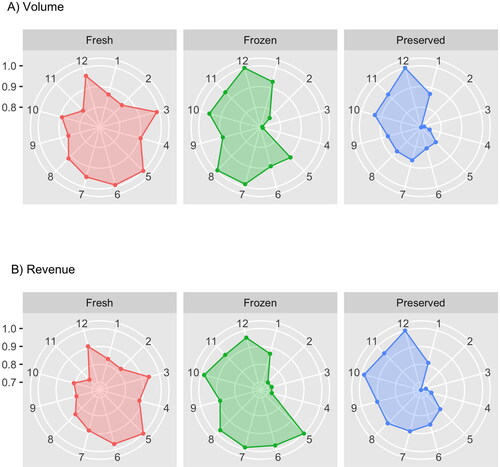
Figure 5. Monthly United States commercial fisheries landings by volume and revenue, average 2017–2019. The y-axis is normalized by dividing the monthly values by the maximum monthly value.
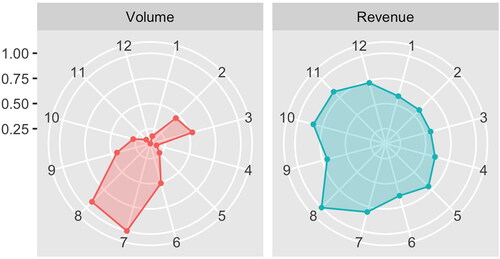
Figure 6. Monthly regional fresh (red line) and frozen (teal line) retail seafood sales by volume and revenue, average 2017–2019. The y-axis is normalized by dividing the monthly values by the maximum monthly value. Acronyms: N.Eng = New England; M. Atl = Middle Atlantic; S. Atl = South Atlantic; Pac = Pacific; G. Lake = Great Lakes; Gulf = Gulf; S. Inl = South Inland; MW. Inl = Midwest Inland; W. Inl = West Inland, US avg = total US average (Regions mapped in ).
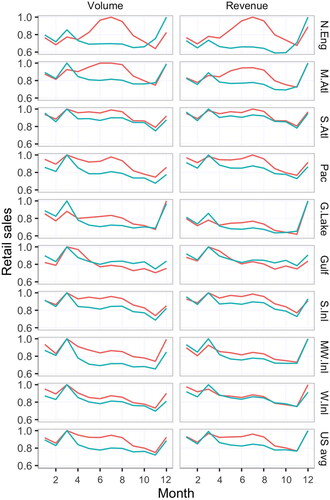
Figure 7. Monthly regional commercial fisheries landings by volume, average 2017–2019. The y-axis is normalized by dividing the monthly values by the maximum monthly value.
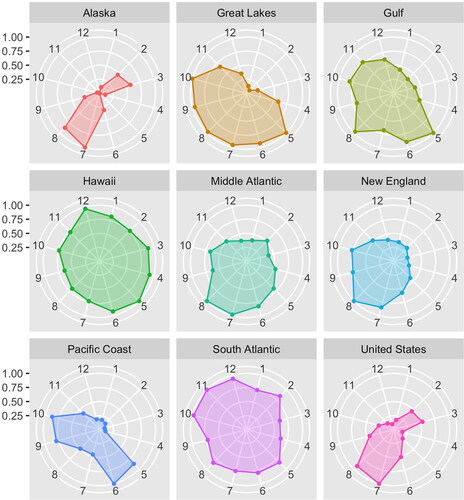
Figure 8. Regional markets for domestic fisheries products showing species groups that are well aligned between regional landings and fresh retail sales. Significant cross correlation coefficients (rho) cutoff ≥0.6. Rho values presented by species group in . Regions provided in .
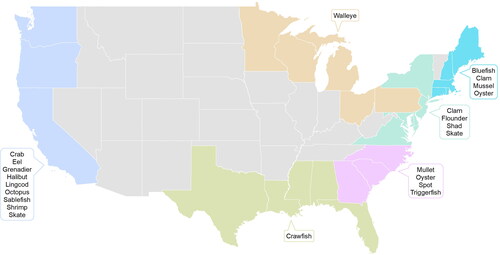
Figure 9. Regional fresh retail seafood sales (teal) versus regional domestic fisheries landings (red). Species groups with correlation coefficients (rho) ≥60 are plotted. Rho values reported in the subtitle. The y-axis is normalized by dividing the monthly values by the maximum monthly value.
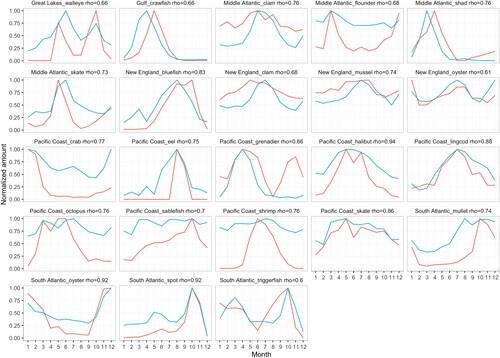
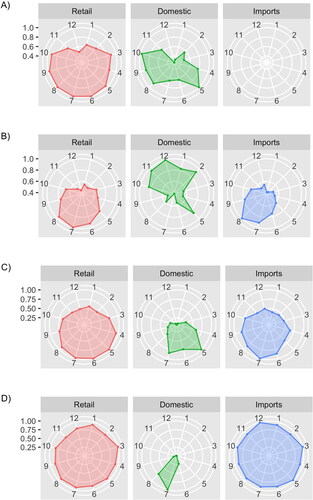
Figure 10. Monthly retail sales, domestic landings, and imports for four example species A) bluefish, B) swordfish, C) halibut, and D) salmon, average 2017–2019. The y-axis is normalized by dividing the monthly values by the maximum monthly value. No imports of bluefish.
Data availability
Data are available upon request. Nielsen is a proprietary dataset and cannot be shared.