Figures & data
Figure 1. Taxa summary plot showing spatially differences in abundance of the Untreated main biofilms for the different phyla (a) and genera (b) in the Untreated main biofilm at 0, 100 and 200 m. At the genus level, only the 20 most abundant genera are shown for simplicity. OTUs which could not be assigned to some known genera (categorised as no_match) were omitted. (c) Alpha diversity calculated as the Shannon Index. Values with no capital letters in common are significantly different (p < 0.05). (d) Principal Coordinate Analysis with Weighted UniFrac distances. The 15 most diverse prokaryotes between the three distances were added as vectors pointing in the direction of increased abundance.
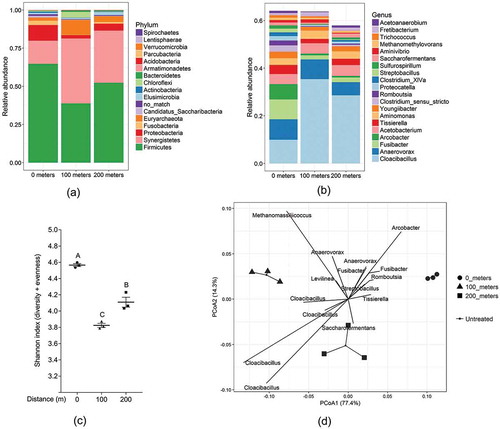
Figure 2. Taxa summary plots at phylum level sorted according to the Untreated (UT) main. (a) 0 m; (d) 100 m; (g) 200 m. Taxa summary plots at the genus level, sorted according to the 20 most abundant genera in the Untreated main at the specific distance. (b) 0 m; (e) 100 m; (h) 200 m. OTUs at the genus level which could not be assigned to some genera are omitted (categorised as no_match). Shannon diversity index at (c) 0 m; (f) 100 m; (i) 200 m. Values with no letters in common are significantly different.
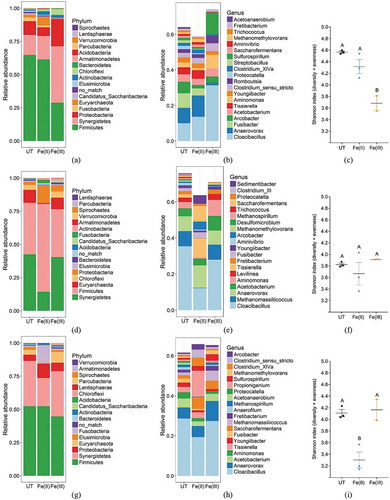
Figure 3. PCoA plot with Weighted UniFrac distances showing separation of the microbiome composition at the three positions (a) 0 m; (b) 100 m; (c) 200 m. PCoA plots with Bray distances of relative abundance of KEGG orthologs (KOs) at 0 m (d), 100 m (e), and 200 m (f). Individual prokaryotic and KO abundances were projected onto the ordination and displayed as vectors pointing in the direction of increased abundance. Only the 15 most extreme prokaryotic and KO vectors are shown for simplicity.
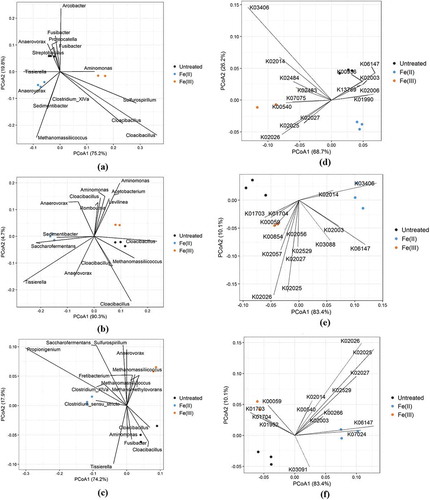
Figure 4. Differences in abundance of genera related to sulphide (left) and methane (right) production due to iron dosing at all three positions. Normalised abundance data for genera with the prefix desulfo, sulfu or methano were extracted from the whole dataset for plotting in a bar graph. Bars, within one genus, with no capital letters (A, B, C) in common are significantly different. Note the logarithmic y-axis scale.
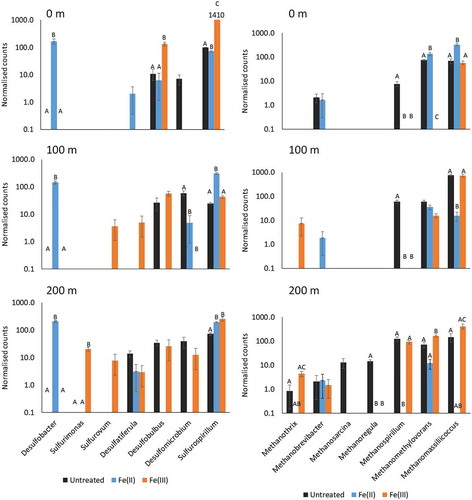
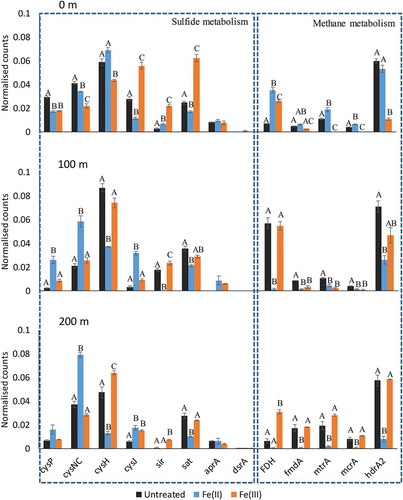
Figure 5. Differences in the functional potential of the microbiome related to sulphur and methane metabolism. Bars, within one function, with no capital letters (A, B, C) in common are significantly different.