
Figures & data
Figure 1. A conceptual model of household water management practices adapted from Lowe, Lynch, and Lowe (Citation2015).
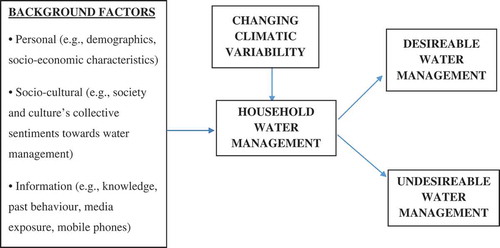
Figure 2. Map of study communities (Tsetsekpo, Sayikope and Klukope) within the Central Tongu district and (Totope) in the Ada-East district of Ghana.
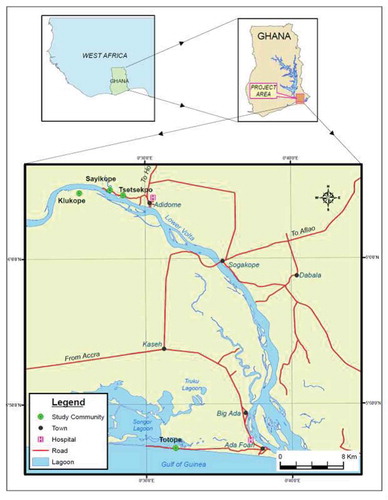
Table 1. Name of communities, number of households and number of questionnaires administered.
Figure 3. Percentage of study respondents from the various communities.
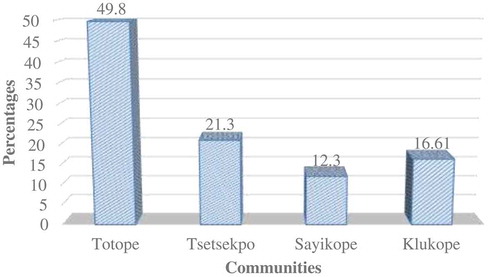
Table 2. Summary of Chi-square analysis between socio-economic factors of respondents and household water management choices.
Figure 4. Level of education among respondents from various communities.
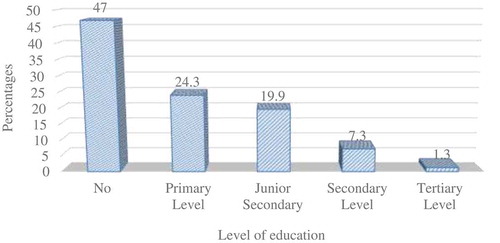
Table 3. Summary of employment and occupation characteristics.
Table 4. Summary of sources of water used within the communities
Table 5. Summary of sources of water used within the communities and the costs.
Table 6. Summary of respondents’ perception of climate change and climate variability
Table 7. Respondents’ views of adapting to climate variability.
Table 8. Summary of household water practices as a means of adapting to climate change and climate variability within the communities.