Figures & data
Table 1. Kinetic models used
Figure 1. SEM-EDS images of apple peel particles. (a) micrograph at 250X (b) micrograph at 2000X (c) spectrogram showing C, O and K.
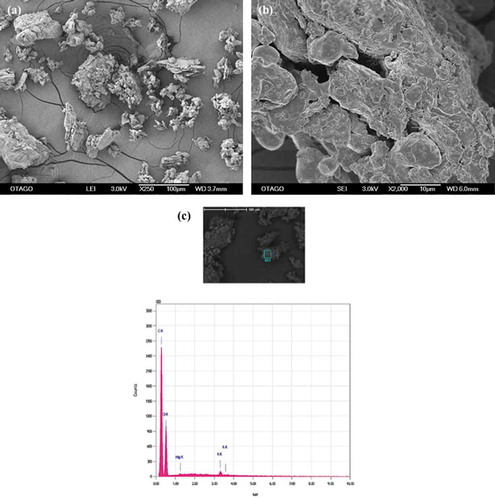
Table 2. Summary of SEM-EDS analysis
Figure 2. SEM-EDS of beads before biosorption. (a) apple peel bead micrograph at 50X (b) apple peel bead micrograph at 2000X (c) control bead micrograph at 50X (d) control bead micrograph at 500 X (e) apple peel bead spectrogram (f) control bead spectrogram.
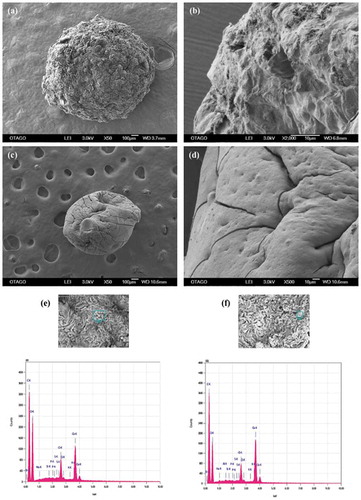
Figure 3. SEM of beads after biosorption. One bead was incubated in a 0.1 mg L−1 cocktail solution of all seven ions for 10 h at pH 7.0, 25ºC and 250 rpm shaking. (a) apple peel bead micrograph at 50X (b) apple peel bead micrograph at 2000X (c) control bead micrograph at 50X (d) control bead micrograph at 500 X (e,f) EDS spectrogram of As, Cr, Hg and Pb attached to apple peel bead (g,h) EDS spectrogram of As, Cr, Cu, Pb and Ni attached to control beads.
Figure 3. (Continued).
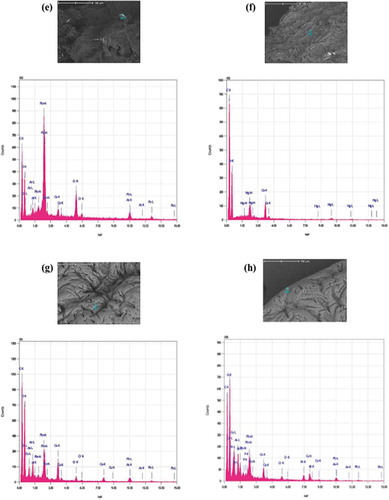
Figure 4. Effect of initial pH on apple peel bead biosorption. One bead was incubated in a 0.1 mg L−1 cocktail solution of all seven ions for 24 h at 25ºC and 250 rpm shaking. The initial pH of each solution was adjusted to 6.5 to 8.5 ± 0.1. The points represent mean ± SEM for n = 3. *significantly different to all other pH conditions for Pb, p < 0.05.
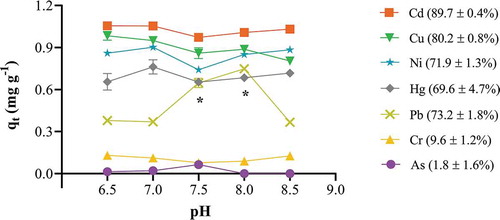
Figure 5. Effect of contact time on bead biosorption. One bead was incubated in a 0.1 mg L−1 cocktail solution of all seven ions at pH 7.0, 25 ºC, for 15 min-72 h continuous shaking at 250 rpm. The points represent mean ± SEM for n = 3 with data analysis by nonlinear regression. (a) apple peel bead (b) control bead.
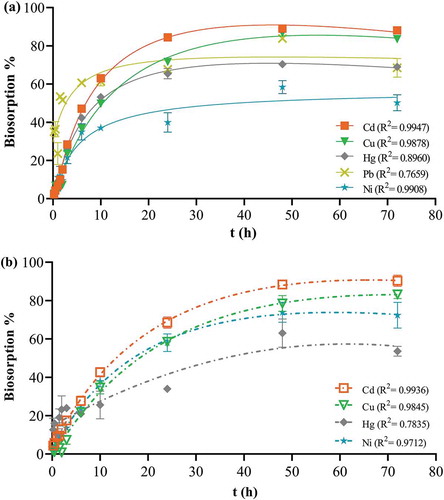
Figure 6. Cumulative biosorption at different contact time points. One bead was incubated in a 0.1 mg L−1 cocktail solution of all seven ions at pH 7.0, 25ºC, for 15 min-72 h continuous shaking at 250 rpm. The bars represent the mean ± SEM for n = 3. *Significantly different cumulative biosorption compared to corresponding control, p < 0.05. Only ions with significant biosorption are shown. AP = apple peel bead, C = control bead.
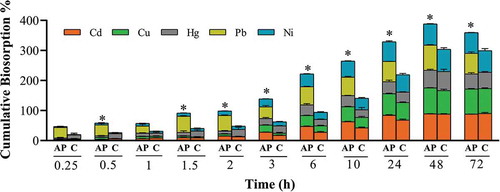
Figure 7. Biosorption process. Representation of the migration of ions from the bulk of the solution to the inner layers of the apple peel bead.
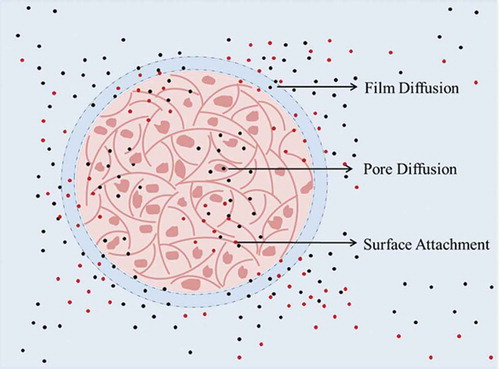
Table 3. Biosorption kinetic model constants
Figure 8. Biosorption kinetic models. One bead was incubated in a 0.1 mgL−1 cocktail solution of all seven ions at pH 7.0, 25ºC, for 15 min-72 h continuous shaking at 250 rpm. The points represent mean ± SEM for n = 3 with data analysis by linear regression. (a) Film diffusion showing results for contact time up to 10 h (b) pore diffusion (c) pseudo-first order showing results for contact time up to 10 h (d) pseudo-second order (e) Elovich plot showing results for contact time up to 3 h.
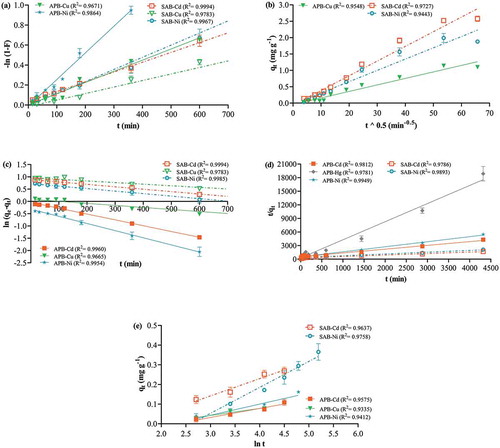
Table 4. Apple peel bead biosorption capacity
Figure 9. Effect of biosorbent concentration. One to ten beads in 1 mg L−1 cocktail solution containing all seven ions each at 1 mgL−1 for 10 h at pH 7.0, 25 ºC and shaking at 250 rpm. The points represent the mean ± SEM for n = 3 with data analysis by nonlinear regression.
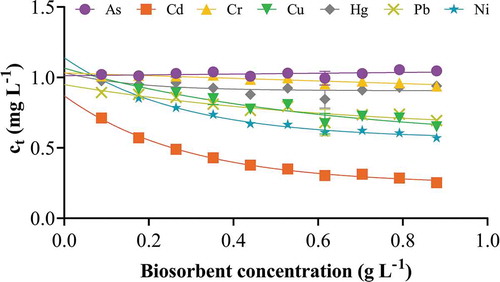
Table 5. Apple peel bead biosorption capacity suppression in the presence of co-ions
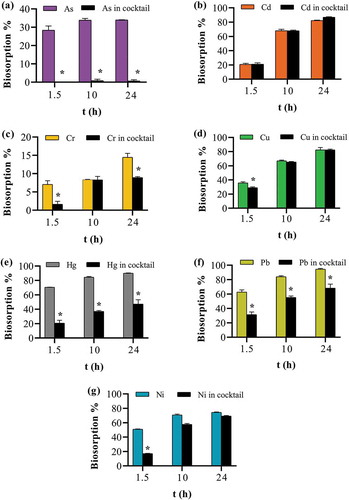
Figure 10. Effect of the presence of co-ions on apple peel bead biosorption. One bead in 0.1 mg L−1 of either a single ion or cocktail solution containing all seven ions each at 0.1 mg L−1 at pH 7.0, 25ºC and 250 continuous shaking at 250 rpm for 1.5, 10 and 24 h. The points represent the mean ± SEM for n = 3. *Significantly different compared to the corresponding cocktail solution, p < 0.05. (a) arsenic (b) cadmium (c) chromium (d) copper (e) mercury (f) lead (g) nickel.