
Figures & data
Figure 1. Map of Lake Tana and surrounding study area (Tegegne et al., Citation2017).
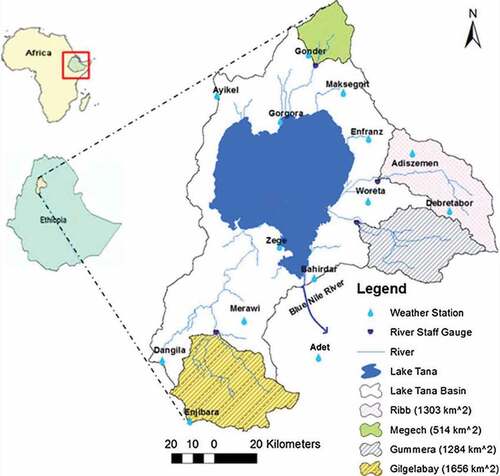
Table 1. Socio-demographic characteristics of key informants around Lake Tana (n = 423)
Table 2. Summary of the assessments of pesticides (herbicides, fungicides and rodenticides) used in farms, around Lake Tana (n = 423)
Table 3. Farmers’ knowledge, attitude and understanding about pesticide (n = 423)
Table 4. Farmers’ practices on use, storage and disposal of pesticides around Lake Tana (n = 423)
Table 5. Bivariate and multivariate analyses of factors associated with poor attitude and practice of pesticide use among farmers, around Lake Tana