Figures & data
Table 1. Results for the test of homogeneity of variances
Table 2. 2 × 3 Factorial MANOVA test
Figure 1. Simple plot of interaction effects between country and gender on knowledge of inclusive education
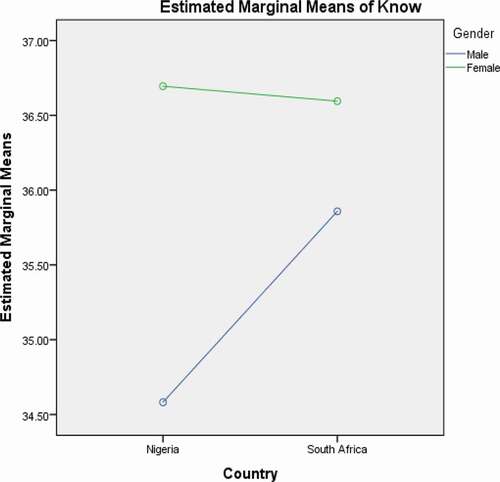
Figure 2. Simple plot of interaction effects between country and gender on attitudes towards inclusive education
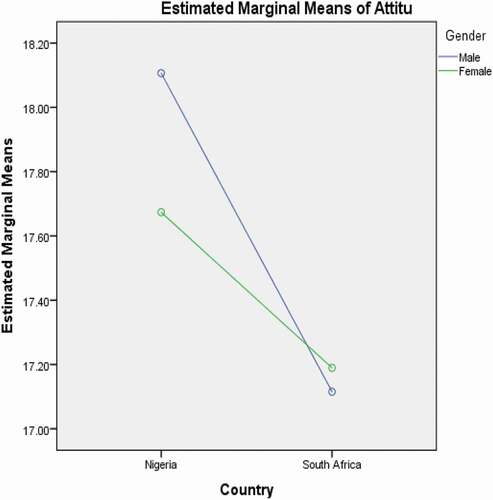
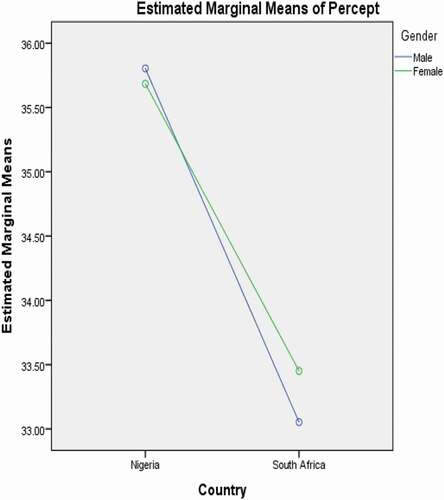
Figure 3. Simple plot on interaction effects between country and gender on perception about inclusive education