
Figures & data
Figure 1. How self-assessment strategy contributes to learning (Adapted from Rolheiser & Ross, Citation2001).
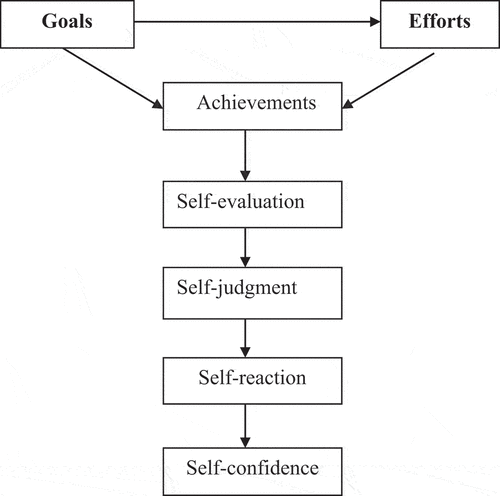
Table 1. The reliability of the questionnaire
Table 2. The faculty and programs of the engineering students
Table 3. Items distribution based on the study factors
Table 4. The value and the range of the engineering perceptions
Table 5. Engineering students’ perceptions in pre-and post-SA implementation in delivering technical oral presentations
Figure 2. Description information differences of the engineering students’ perceptions about SA.
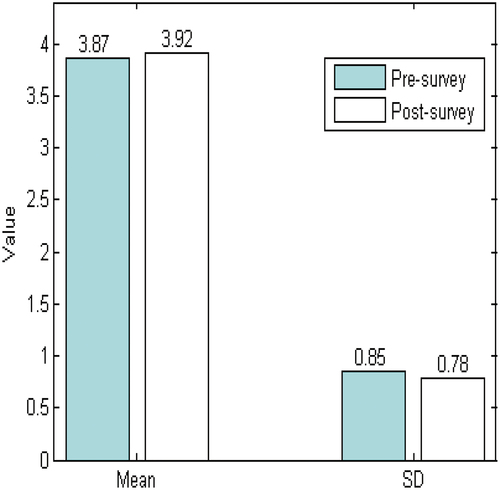
Table 6. Overall M.s and Std. D.s for participants’ perceptions on self-assessment strategy (Pre-and post-questionnaire)