
Figures & data
Figure 1. (a) Distribution of science instructors by gender. (b) Distribution of science instructors by school type. (c) Distribution of science instructors by school location. (d) Distribution of science instructors by academic qualification. (e) Distribution of science instructors by years of teaching experience.
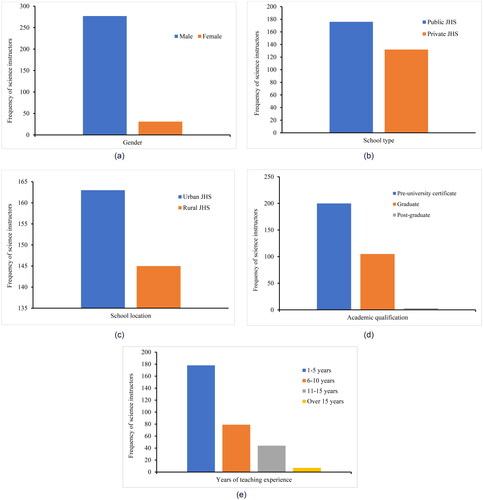
Table 1. Descriptive statistics of instructors’ personal science teaching efficacy (PSTE) and science teaching outcome expectancy (STOE).
Table 2. One-way MANOVA of differences in science instructors’ self-efficacy based on school-type.
Table 3. One-way ANOVAs of differences in instructors’ STOE and PSTE based on school-type.
Table 4. Average item means and average item standard deviations of public and private JHS instructors’ ratings of items on science teaching outcome expectancy (STOE).
Table 5. Average item means and average item standard deviations of public and private JHS instructors’ ratings of items on personal science teaching efficacy (PSTE).
Table 6. One-way MANOVA of differences in science instructors’ self-efficacy based on school location.
Table 7. One-way ANOVAs of differences in instructors’ STOE and PSTE based on school location.
Table 8. Average item means and average item standard deviations of rural and urban JHS instructors’ ratings of items on personal science teaching efficacy (PSTE).
Table 9. One-way MANOVA of differences in science instructors’ self-efficacy based on academic qualification.
Table 10. One-way ANOVAs of differences in instructors’ STOE and PSTE based on academic qualification.
Table 11. Scheffe post-hoc analysis of differences in instructors PSTE based on academic qualification.
Table 12. Average item means and average item standard deviations of graduate and certificate JHS instructors’ ratings of items on personal science teaching efficacy (PSTE).
Table 13. Scheffe post-hoc analysis of differences in instructors STOE based on academic qualification.
Table 14. Average item means and average item standard deviations of graduate and pre-university certificate JHS instructors’ ratings of items on science teaching outcome expectancy (STOE).