3,246
Views
4
CrossRef citations to date
0
Altmetric
Research Article

The spatiality of specialty coffee bars and the cognitive-cultural economy in Amsterdam

| (Reviewing Editor)
Article: 1144232 | Received 12 Oct 2015, Accepted 15 Jan 2016, Published online: 12 Feb 2016

Figures & data

Figure 1. The number of economic opportunities in Amsterdam in different sectors in 2014.
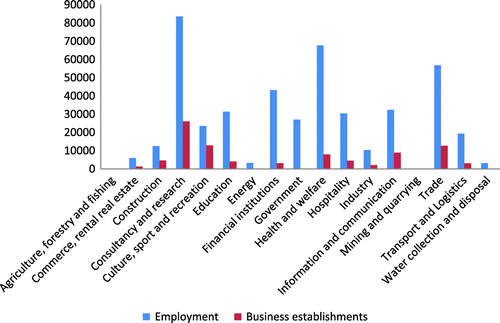
Source: O+S Amsterdam (Citation2015).
Figure 1. The number of economic opportunities in Amsterdam in different sectors in 2014.

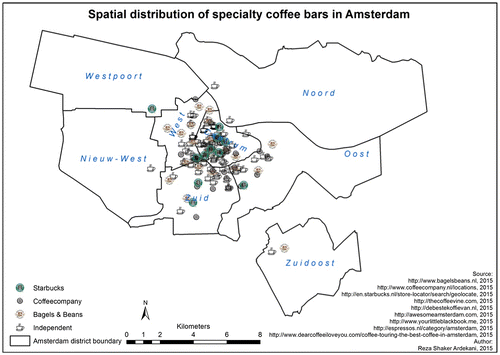
Figure 2. Spatial distribution of SCBs represented via a point-in-polygon method.

Source: Author.
Figure 2. Spatial distribution of SCBs represented via a point-in-polygon method.

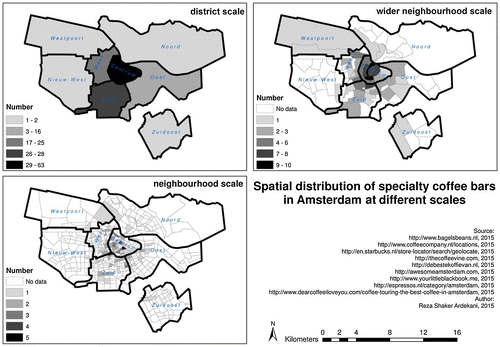
Figure 3. Spatial concentration of SCBs at different scales.

Source: Author.
Figure 3. Spatial concentration of SCBs at different scales.

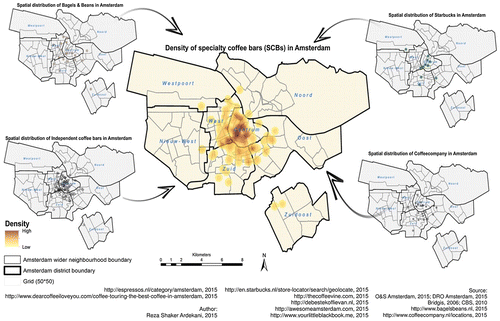
Figure 4. Spatial distribution and density of SCBs.

Source: Author.
Figure 4. Spatial distribution and density of SCBs.

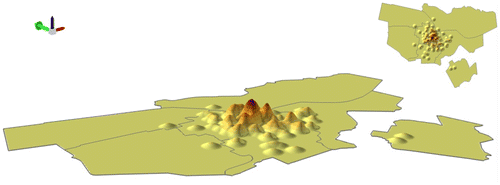
Figure 5. 3D visualisation of the density of SCBs.

Source: Author.
Figure 5. 3D visualisation of the density of SCBs.

Figure 6. Spatial correlation between business establishments in different economic sectors and SCBs at district scale.
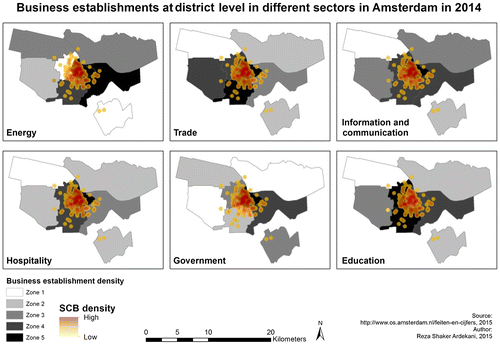
Source: Author.
Figure 6. Spatial correlation between business establishments in different economic sectors and SCBs at district scale.

Figure 7. Spatial correlation between employment in different economic sectors and SCBs at district scale.
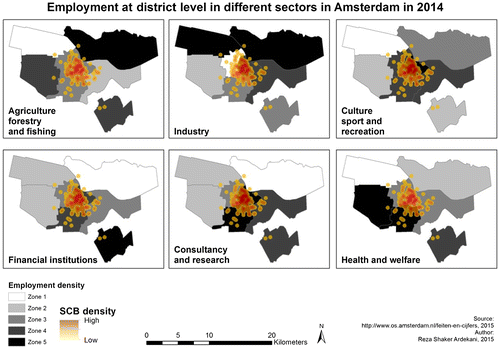
Source: Author.
Figure 7. Spatial correlation between employment in different economic sectors and SCBs at district scale.

Table 1. The number of SCBs in the top five sectors of business establishment and employment in zone 5 at district scale

Figure 8. The number of economic opportunities in different districts of Amsterdam.
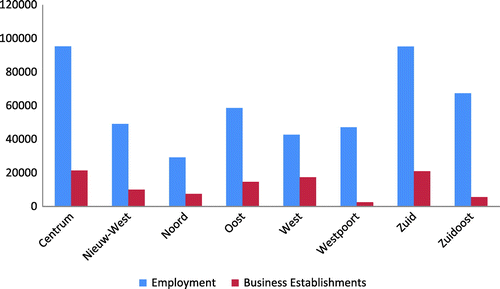
Source: O+S Amsterdam (Citation2015).
Figure 8. The number of economic opportunities in different districts of Amsterdam.

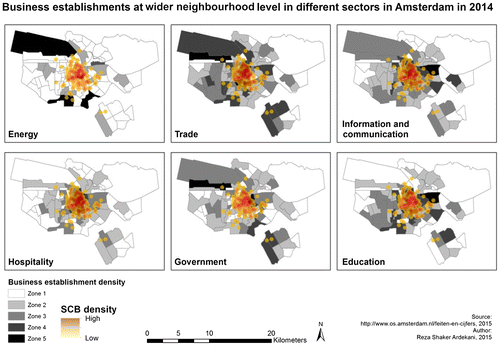
Figure 9. Spatial correlation between different sectors of business establishment and SCBs at the wider neighbourhood scale.
Source: Author.
Figure 9. Spatial correlation between different sectors of business establishment and SCBs at the wider neighbourhood scale.

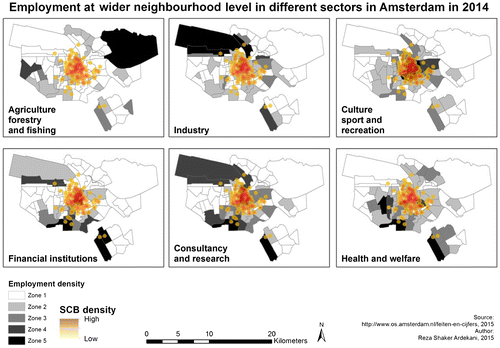
Figure 10. Spatial correlation between different sectors of employment and SCBs at the wider-neighbourhood scale.
Source: Author.
Figure 10. Spatial correlation between different sectors of employment and SCBs at the wider-neighbourhood scale.

Table 2. The number of SCBs in the top five sectors of business establishment and employment in zones 4 and 5 at the wider neighbourhood scale

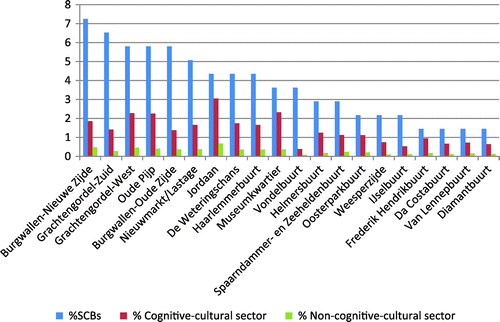
Figure 11. The statistical connection between the overall composition of the economic establishments of zones and SCBs amongst the top 20 regions.
Source: Author.
Figure 11. The statistical connection between the overall composition of the economic establishments of zones and SCBs amongst the top 20 regions.

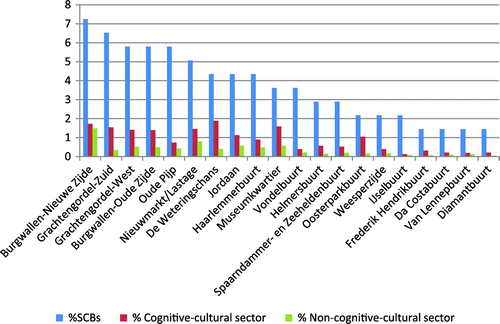
Figure 12. The statistical connection between the overall employment composition of zones and SCBs amongst the top 20 regions.
Source: Author.
Figure 12. The statistical connection between the overall employment composition of zones and SCBs amongst the top 20 regions.