Figures & data
Figure 1. Mortality rate for diseases of the circulatory system and cancer in Portugal (1960–2013), according to data from the OECD (OECD Health Statistics 2015, www.oecd.org/els/health-systems/health-data.htm).
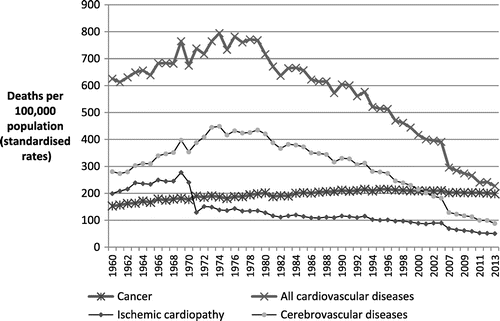
Figure 2. Relationship between total investment in health (current prices, per capita, US dollar) and potential years of life lost for all causes, circulatory diseases and neoplasms, 0–69 years, in 2010, in OECD countries (OECD Health Data, 2017).
Notes: Countries of OECD included in this evaluation: Australia, Austria, Belgium, Canada, Chile, Czech Republic, Denmark, Estonia, Finland, France, Germany, Greece, Hungary, Ireland, Israel, Italy, Japan, Korea, Latvia, Luxembourg, Mexico, Netherlands, New Zealand, Norway, Poland, Portugal, Slovak Republic, Slovenia, Spain, Sweden, Switzerland, Turkey, United Kingdom and United States.
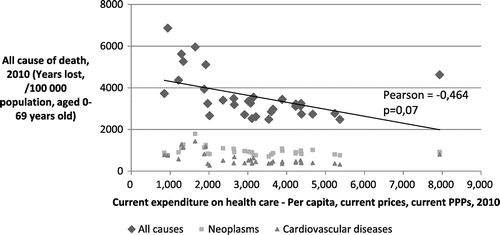
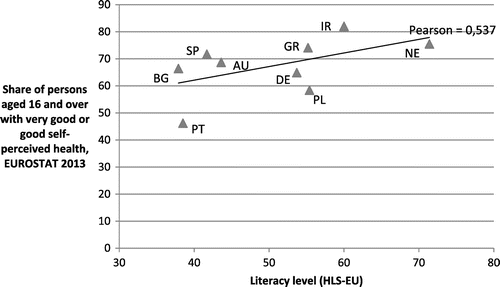
Figure 3. Self-perception of health depending on the literacy levels in the population included in the study HLS-I.
Source: Sorensen et al. and EUROSTAT (http://ec.europa.eu/eurostat). AU-Austria, BG-Bulgaria, DE-Germany, GR-Greece, IR-Ireland, NE-Netherlands, PL-Poland, PT-Portugal, SP-Spain.