Figures & data
Table 1. Key variables and their data sources
Figure 1. Global Moran’s I scatterplot of the number of hotels
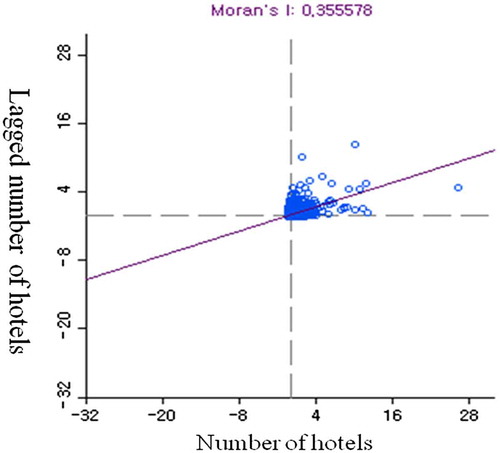
Figure 2. Local Moran’s I cluster map of the number of hotels
Table 2. Regional distribution of hotel/lodging businesses in US states
Figure 3. The local bivariate correlation between natural amenities and the spatial lag of hotel distributions
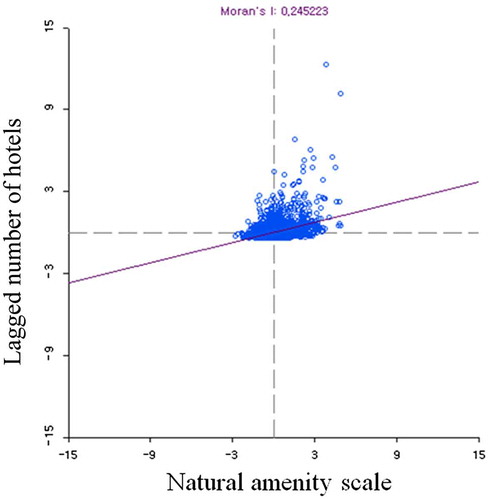
Figure 4. A BiLisa cluster map between the natural amenity scale and spatial lag of the number of hotels
Figure 5. The local bivariate correlation between the level of ruralization and spatial lag of hotel distribution
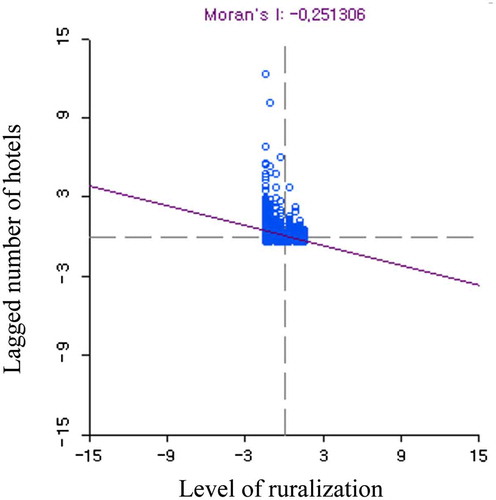
Figure 6. BiLisa Cluster map between the level of ruralization and spatial lag of the number of hotels
Figure 7. The local bivariate correlation between the constructed amenity scale and spatial lag of hotel distribution
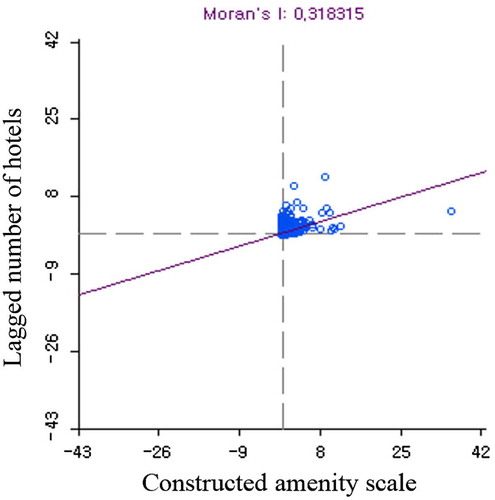
Figure 8. BiLisa cluster map between the constructed amenity scale and spatial lag of the number of hotels
Figure 9. The local bivariate correlation between the population density and spatial lag of hotel distribution
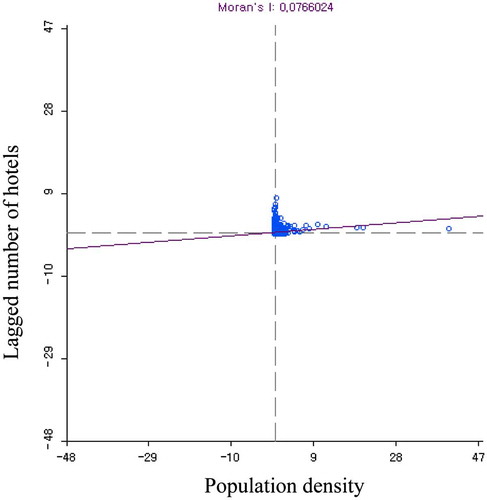
Figure 10. BiLisa cluster map between the population density and spatial lag of the number of hotels