
Figures & data
Table 1. Wards with the highest multi-hazard indices
Figure 1. Maps showing the study area locations in Zimbabwe
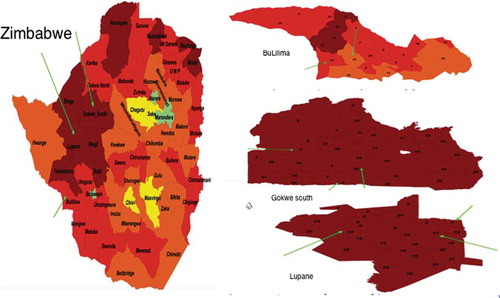
Table 2. Indicators used to derive the climate change socio-economic vulnerability index
Box 1. Exposure perspectives in the districts
Box 2. Institutional limitations
Table 3. BuLilima SECCVI
Table 4. Gokwe south SECCVI
Table 5. Lupane SECCVI
Table A1. BuLilima district qualitative data respondents
Table A2. Gokwe south district qualitative data respondents
Table A3. Lupane district qualitative data respondents
Data Availability Statement
Raw data were generated at The Institute of Development Studies of the National University of Science and Technology and the Ministry of Environment Water and Climate. Derived data supporting the findings of this study are available from the corresponding author (Nqobizitha Dube) on request.