
Figures & data
Figure 1. Ethiopia urbanization trend and projection to 2050. Source (Eastwood & Lipton, Citation2011)
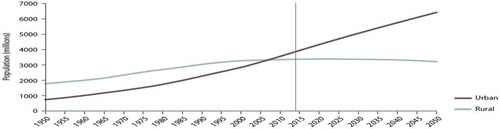
Figure 2. Conceptual framework for the analysis of Bahir Dar city peri-urban household livelihoods. Source: Adopted from DFID's sustainable livelihood framework (DfID, UK, Citation1999) and sustainable rural livelihood framework (Tuyen, Lim, Cameron, & Huong, Citation2014)
Figure 3. Map of Bahir Dar City Administration and peri-urban areas
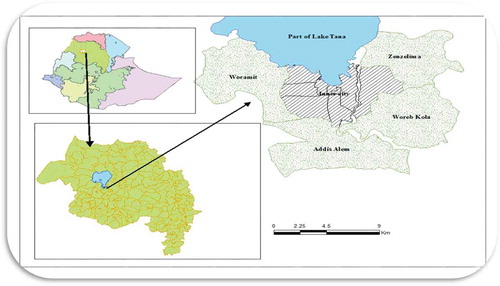
Table 1. Population and sample size of each peri-urban kebele
Table 2. Definition and measurement of independent variables in PSM and MNLM logit model
Table 3. Summary statistics and mean difference test on the continuous variable
Table 4. Summary statistics and proportional difference test between categorical variables
Table 5. Logistic regression model result for displacement status
Table 6. Impacts of urban expansion displacement on the farming community
Table 7. Households' past and current livelihood strategies
Table 8. Households' past and current livelihood activities
Table 9. Mean household income and percentage composition by current livelihood strategy
Table 10. Mean household livelihood outcome and percentage composition by current livelihood strategy
Table 11. Summary statistics of independent variables for household strategy choice
Table 12. MNLM estimation with a relative risk ratio for households’ livelihood strategy choices