
Figures & data
Figure 1. Allocation map of study area.
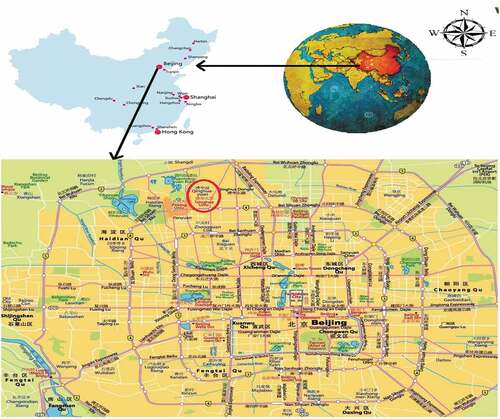
Table 1. Campus tourism comparison among world top ranked universities with Tsinghua University
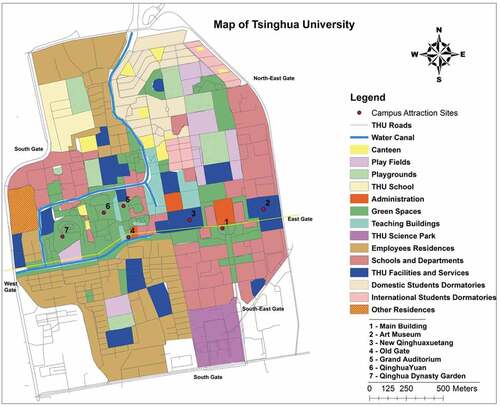
Figure 2. Detailed map of Tsinghua University (The Tsinghua University, Citation2017).
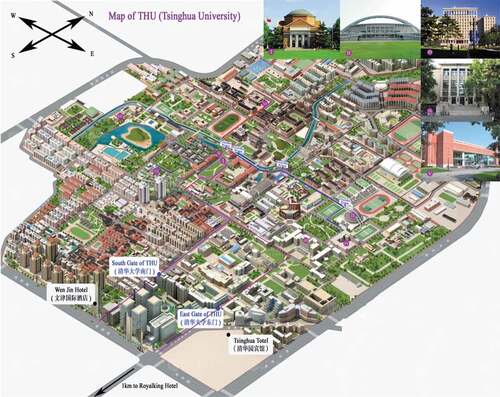
Figure 3. Gender of respondents.
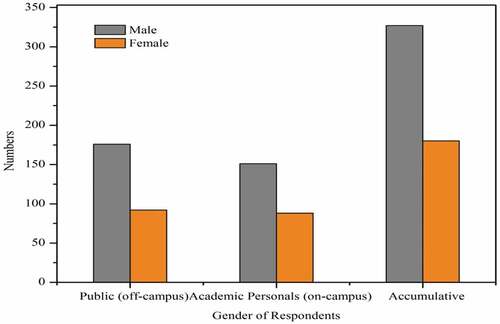
Figure 4. Age of respondents.
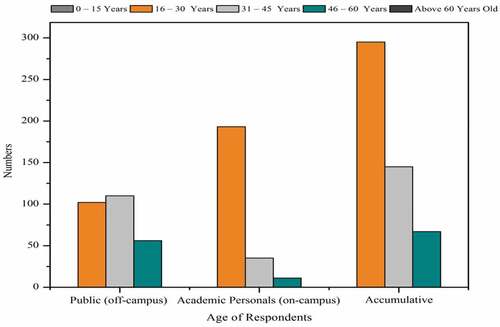
Figure 5. Education of respondents.
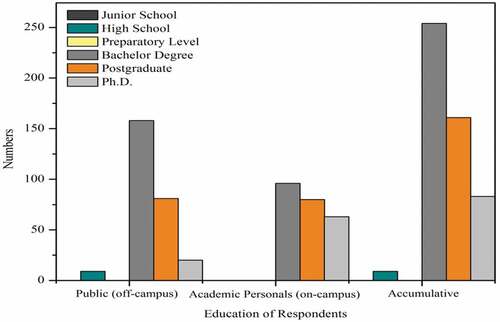
Figure 6. Public and academic personals’ support to campus-based tourism.
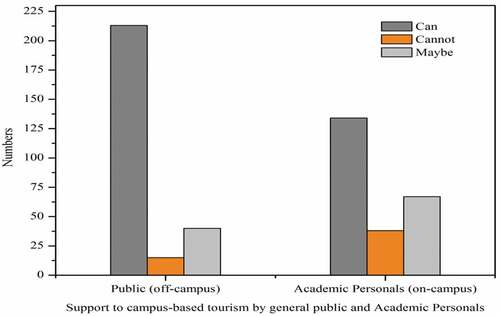
Figure 7. Public and academic personals’ support to organize campus visits instead of the ban by campus management.
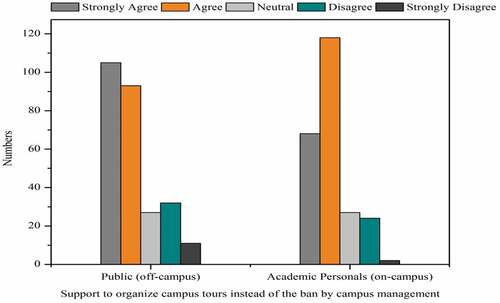
Figure 8. Public and academic personals’ response to academic disturbances by campus tourism.
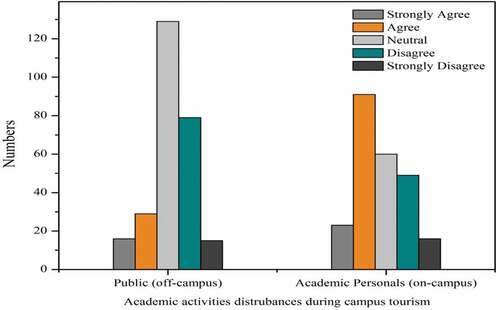
Figure 9. General public and academic personals’ response to campus-based tourism benefits.
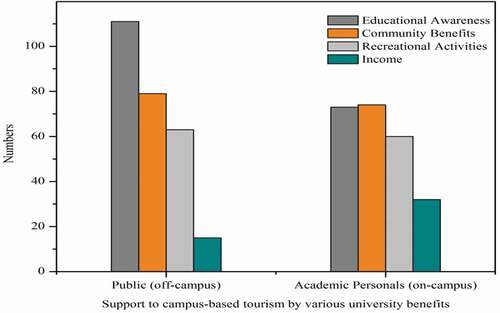
Figure 10. General public and academic personals’ response to days suggested for campus visits.
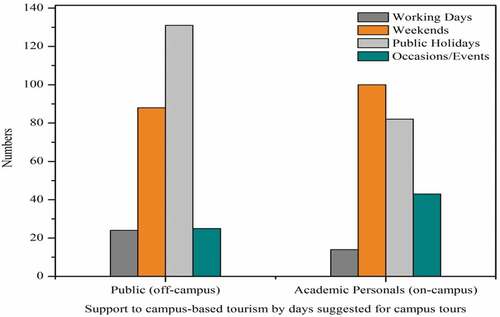
Table 2. ANOVA analysis impact on support to campus-based tourism by general public (off-campus) and academic personals (on-campus)
Table 3. ANOVA analysis impact on support to organize campus tours instead of the ban by campus management
Table 4. ANOVA analysis impact on academic disturbances during campus tourism
Table 5. ANOVA analysis impact on support to campus-based tourism by various university benefits (off-campus public)
Table 6. ANOVA analysis impact on support to campus-based tourism by various university benefits (on-campus academic personals)
Table 7. ANOVA analysis impact on support to campus-based tourism by days suggested for campus tours
Table 8. ANOVA analysis impact on support to campus-based tourism by days suggested for campus tours
Figure 11. Public (off-campus) desires support to campus-based tourism.
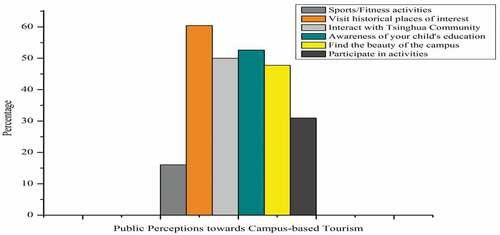
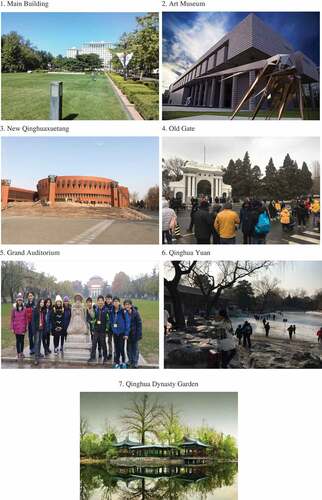
Figure 12. Map of present tourism attractions of Tsinghua University.
Gender of respondents (Figure )
Age of respondents (Figure )
Education of respondents (Figure )
Public perceptions towards campus-based tourism (Multiple Choices) (Figure )
Table A2. ANOVA analysis impact on support to campus-based tourism (Do you think that university campus can be open for tourism?)
Table A3. ANOVA analysis impact on support to organize campus tours instead of ban (Do you think campus management should manage travel instead of completely restricting visitors?)
Table A4. ANOVA analysis impact on academic disturbances during campus tourism (Does educational environment disturb during public tourism inside the campus?)
Table A5. ANOVA analysis impact on support to campus-based tourism by various university benefits (Do you think the university will benefit from tourism?)
Table A6. ANOVA analysis impact on support to campus-based tourism by days suggested for campus tours