Figures & data
Figure 1. Line graph showing movements of financial inclusion by usage
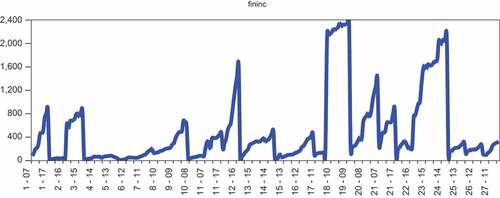
Figure 2. Line graph showing movements of financial inclusion by quality
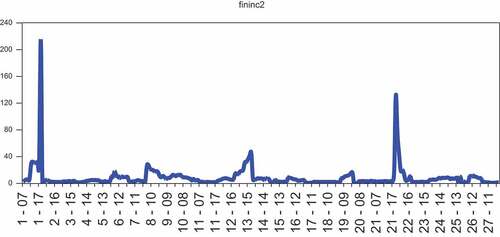
Figure 3. Line graph showing movements of financial exclusion by unemployment
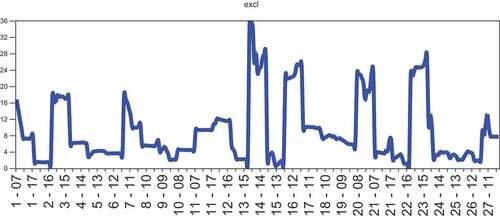
Figure 4. Box plot showing the distribution pattern of underlying variables
Note that the first, second, and third box plots show the distribution pattern of financial inclusion (quality), financial inclusion (usage) and financial exclusion respectively
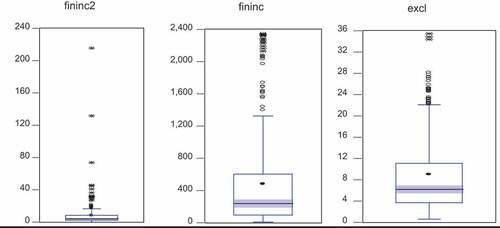
Figure 5. Quarter-quarter plot showing the distribution pattern of underlying variables
Note that the first, second and third quarter-quarter plots show the distribution pattern of the, financial inclusion (quality), financial inclusion (usage) and financial exclusion respectively
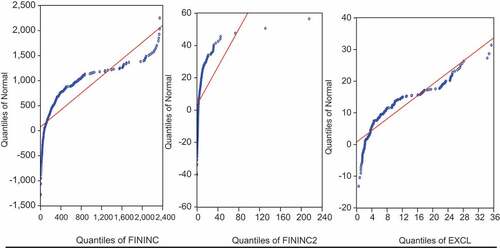
Table 1. Showing statistics from 2007–2017 in their raw value quantities
Table 2. Financial exclusion-inclusion nexus from 2007 to 2017
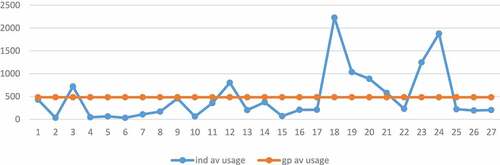
Figure 6. Individual country’s average financial service usage
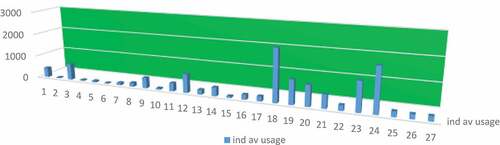
Figure 7. Decomposing countries into high and low usage of financial services