
Figures & data
Table 1. Weeds reported to be associated with sorghum
Table 2. Reported herbicide resistance in weeds associated with sorghum
Figure 1. Temperature and rainfall data for Chipinge (a) and Insiza (b) districts in the 2016/17 season
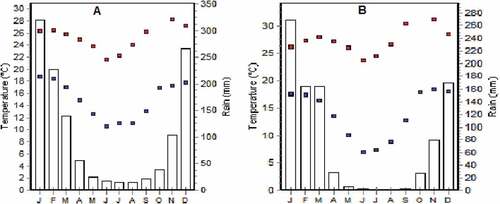
Table 3. Summary of sampling strategy used
Table 4. Weed management methods used in Insiza and Chipinge districts (N = 80)
Table 5. Hand hoeing frequency
Table 6. Major weeds recorded (per square metre) in sorghum fields in Chipinge and Insiza districts
Table 7. Comparison of weeds reported in current survey and those reported in 1988