
Figures & data
Table 1. Demographic characteristics of participants
Figure 1. Illustration on government and nongovernment communication strategies on hepatitis B virus.
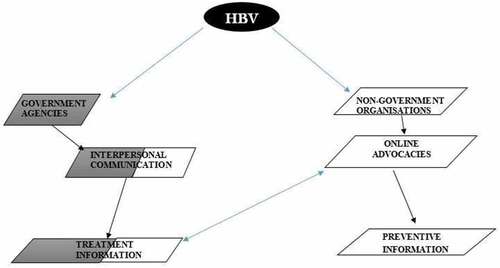
Table 2. Preferred health communication channel by respondents age
Table 3. Preferred health communication channel by respondents age
Table 4. Preferred health communication channel by respondents educational qualification
Table 5. Preferred health communication channel by respondents occupation
Table 6. Preferred health communication channel by respondents religion