
Figures & data
Figure 1. Map of Mpakeni.
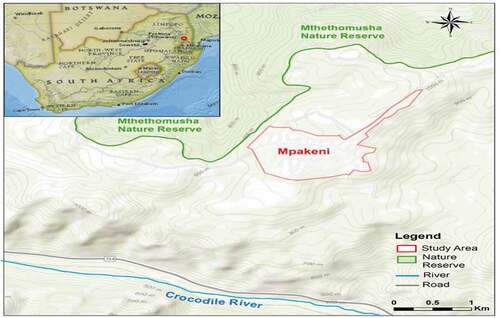
Table 1. Participants’ distribution and household heads
Figure 2. Precipitation data of Mpumalanga province, South Africa from 1980 to 2018. Source: Modern-era retrospective analysis for research application (MERRA-2) model (2020).
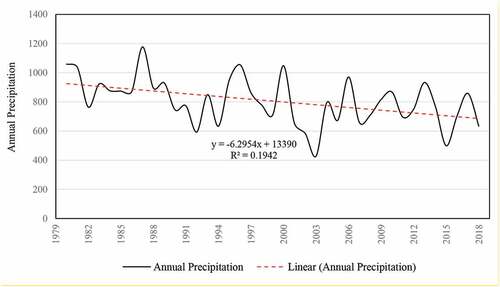
Figure 3. Types of drought. Source:.National Drought Mitigation Center (NDMC) (Citation2019)
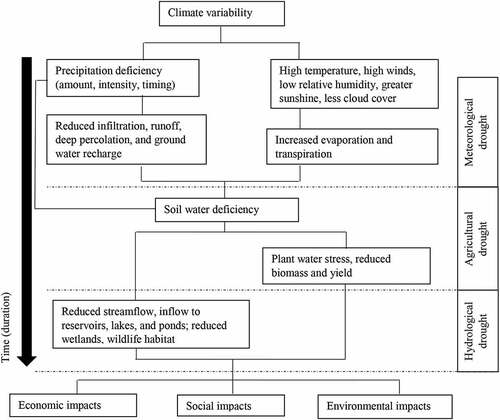
Table 2. Differential vulnerability to drought among non-elites in Mpakeni